
Sierpinski square curve: Difference between revisions
(J draft) |
m (→{{header|J}}) |
||
| Line 240: | Line 240: | ||
=={{header|J}}== |
=={{header|J}}== |
||
It looks like there's two different (though similar) concepts implemented here, of what a "Sierpinski square curve" looks like. And, the wikipedia writeup is |
It looks like there's two different (though similar) concepts implemented here, of what a "Sierpinski square curve" looks like (the wikipedia writeup shows 45 degree angles -- like [[j:File:Sierpinski_curve.png]] but many of the implementations here show only right angles). And, the wikipedia writeup is obtuse about some of the details of the structure. And, we've got some dead links here. So, for now, a quickie ascii art implementation:<lang J> 1j1#"1' #'{~{{l,(1,~0{.~#y),l=.y,.0,.y}}^:3,.1 |
||
# # # # # # # # |
# # # # # # # # |
||
# # # # |
# # # # |
||
| Line 256: | Line 256: | ||
# # # # |
# # # # |
||
# # # # # # # # </lang> |
# # # # # # # # </lang> |
||
=={{header|Java}}== |
=={{header|Java}}== |
||
{{trans|C++}} |
{{trans|C++}} |
||
Revision as of 11:02, 17 July 2022

You are encouraged to solve this task according to the task description, using any language you may know.
- Task
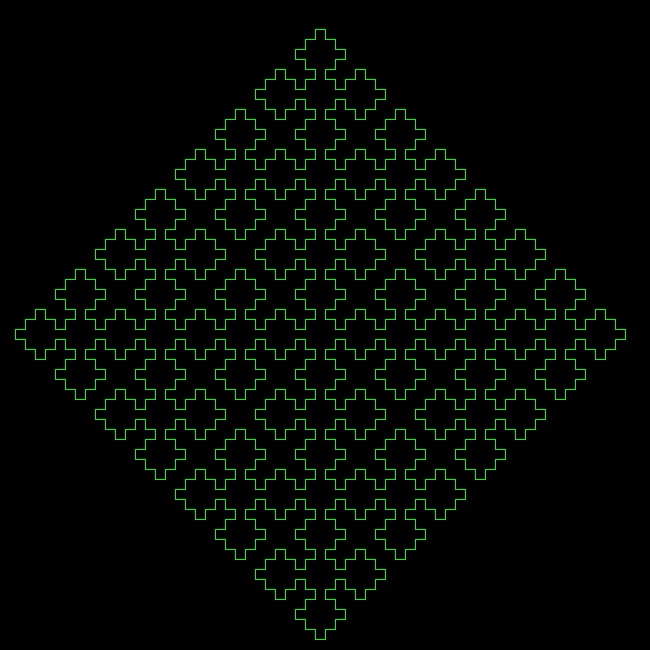
Produce a graphical or ASCII-art representation of a Sierpinski square curve of at least order 3.
11l
<lang 11l>F sierpinski_square(fname, size, length, order)
  V x = (size - length) / 2
  V y = Float(length)
  V angle = 0.0
  V outfile = File(fname, ‘w’)
  outfile.write(‘<svg xmlns='http://www.w3.org/2000/svg' width='’size‘' height='’size"'>\n")
  outfile.write("<rect width='100%' height='100%' fill='white'/>\n")
  outfile.write(‘<path stroke-width='1' stroke='black' fill='none' d='’)
  V s = ‘F+XF+F+XF’
  L 0 .< order
     s = s.replace(‘X’, ‘XF-F+F-XF+F+XF-F+F-X’)
  outfile.write(‘M’x‘,’y)
  L(c) s
     S c
        ‘F’
           x += length * cos(radians(angle))
           y += length * sin(radians(angle))
           outfile.write(‘ L’x‘,’y)
        ‘+’
           angle = (angle + 90) % 360
        ‘-’
           angle = (angle - 90 + 360) % 360
outfile.write("'/>\n</svg>\n")
sierpinski_square(‘sierpinski_square.svg’, 635, 5, 5)</lang>
- Output:
Output is similar to C++.
C++
Output is a file in SVG format. <lang cpp>// See https://en.wikipedia.org/wiki/Sierpi%C5%84ski_curve#Representation_as_Lindenmayer_system
- include <cmath>
- include <fstream>
- include <iostream>
- include <string>
class sierpinski_square { public:
void write(std::ostream& out, int size, int length, int order);
private:
   static std::string rewrite(const std::string& s);
   void line(std::ostream& out);
   void execute(std::ostream& out, const std::string& s);
   double x_;
   double y_;
   int angle_;
   int length_;
};
void sierpinski_square::write(std::ostream& out, int size, int length, int order) {
   length_ = length;
   x_ = (size - length)/2;
   y_ = length;
   angle_ = 0;
   out << "<svg xmlns='http://www.w3.org/2000/svg' width='"
       << size << "' height='" << size << "'>\n";
   out << "<rect width='100%' height='100%' fill='white'/>\n";
   out << "<path stroke-width='1' stroke='black' fill='none' d='";
   std::string s = "F+XF+F+XF";
   for (int i = 0; i < order; ++i)
       s = rewrite(s);
   execute(out, s);
   out << "'/>\n</svg>\n";
}
std::string sierpinski_square::rewrite(const std::string& s) {
   std::string t;
   for (char c : s) {
       if (c == 'X')
           t += "XF-F+F-XF+F+XF-F+F-X";
       else
           t += c;
   }
   return t;
}
void sierpinski_square::line(std::ostream& out) {
   double theta = (3.14159265359 * angle_)/180.0;
   x_ += length_ * std::cos(theta);
   y_ += length_ * std::sin(theta);
   out << " L" << x_ << ',' << y_;
}
void sierpinski_square::execute(std::ostream& out, const std::string& s) {
   out << 'M' << x_ << ',' << y_;
   for (char c : s) {
       switch (c) {
       case 'F':
           line(out);
           break;
       case '+':
           angle_ = (angle_ + 90) % 360;
           break;
       case '-':
           angle_ = (angle_ - 90) % 360;
           break;
       }
   }
}
int main() {
   std::ofstream out("sierpinski_square.svg");
   if (!out) {
       std::cerr << "Cannot open output file\n";
       return 1;
   }
   sierpinski_square s;
   s.write(out, 635, 5, 5);
   return 0;
}</lang>
- Output:
See: sierpinski_square.svg (offsite SVG image)
Factor
<lang factor>USING: accessors kernel L-system sequences ui ;
- square-curve ( L-system -- L-system )
   L-parser-dialect >>commands
   [ 90 >>angle ] >>turtle-values
   "F+XF+F+XF" >>axiom
   {
       { "X" "XF-F+F-XF+F+XF-F+F-X" }
   } >>rules ;
[
   <L-system> square-curve
   "Sierpinski square curve" open-window
] with-ui</lang>
When using the L-system visualizer, the following controls apply:
| Button | Command |
|---|---|
| a | zoom in |
| z | zoom out |
| left arrow | turn left |
| right arrow | turn right |
| up arrow | pitch down |
| down arrow | pitch up |
| q | roll left |
| w | roll right |
| Button | Command |
|---|---|
| x | iterate L-system |
Go
The following uses the Lindenmayer system with the appropriate parameters from the Wikipedia article and produces a similar image (apart from the colors, yellow on blue) to the Sidef and zkl entries. <lang go>package main
import (
   "github.com/fogleman/gg"
   "github.com/trubitsyn/go-lindenmayer"
   "log"
   "math"
)
const twoPi = 2 * math.Pi
var (
   width  = 770.0
   height = 770.0
   dc     = gg.NewContext(int(width), int(height))
)
var cx, cy, h, theta float64
func main() {
   dc.SetRGB(0, 0, 1) // blue background
   dc.Clear()
   cx, cy = 10, height/2+5
   h = 6
   sys := lindenmayer.Lsystem{
       Variables: []rune{'X'},
       Constants: []rune{'F', '+', '-'},
       Axiom:     "F+XF+F+XF",
       Rules: []lindenmayer.Rule{
           {"X", "XF-F+F-XF+F+XF-F+F-X"},
       },
       Angle: math.Pi / 2, // 90 degrees in radians
   }
   result := lindenmayer.Iterate(&sys, 5)
   operations := map[rune]func(){
       'F': func() {
           newX, newY := cx+h*math.Sin(theta), cy-h*math.Cos(theta)
           dc.LineTo(newX, newY)
           cx, cy = newX, newY
       },
       '+': func() {
           theta = math.Mod(theta+sys.Angle, twoPi)
       },
       '-': func() {
           theta = math.Mod(theta-sys.Angle, twoPi)
       },
   }
   if err := lindenmayer.Process(result, operations); err != nil {
       log.Fatal(err)
   }
   // needed to close the square at the extreme left
   operations['+']()
   operations['F']()
   // create the image and save it
   dc.SetRGB255(255, 255, 0) // yellow curve
   dc.SetLineWidth(2)
   dc.Stroke()
   dc.SavePNG("sierpinski_square_curve.png")
}</lang>
J
It looks like there's two different (though similar) concepts implemented here, of what a "Sierpinski square curve" looks like (the wikipedia writeup shows 45 degree angles -- like j:File:Sierpinski_curve.png but many of the implementations here show only right angles). And, the wikipedia writeup is obtuse about some of the details of the structure. And, we've got some dead links here. So, for now, a quickie ascii art implementation:<lang J> 1j1#"1' #'{~{{l,(1,~0{.~#y),l=.y,.0,.y}}^:3,.1
- # # # # # # #
# # # #
- # # # # # # #
# #
- # # # # # # #
# # # #
- # # # # # # #
#
- # # # # # # #
# # # #
- # # # # # # #
# #
- # # # # # # #
# # # #
- # # # # # # # </lang>
Java
<lang java>import java.io.*;
public class SierpinskiSquareCurve {
   public static void main(final String[] args) {
       try (Writer writer = new BufferedWriter(new FileWriter("sierpinski_square.svg"))) {
           SierpinskiSquareCurve s = new SierpinskiSquareCurve(writer);
           int size = 635, length = 5;
           s.currentAngle = 0;
           s.currentX = (size - length)/2;
           s.currentY = length;
           s.lineLength = length;
           s.begin(size);
           s.execute(rewrite(5));
           s.end();
       } catch (final Exception ex) {
           ex.printStackTrace();
       }
   }
   private SierpinskiSquareCurve(final Writer writer) {
       this.writer = writer;
   }
   private void begin(final int size) throws IOException {
       write("<svg xmlns='http://www.w3.org/2000/svg' width='%d' height='%d'>\n", size, size);
       write("<rect width='100%%' height='100%%' fill='white'/>\n");
       write("<path stroke-width='1' stroke='black' fill='none' d='");
   }
   private void end() throws IOException {
       write("'/>\n</svg>\n");
   }
   private void execute(final String s) throws IOException {
       write("M%g,%g\n", currentX, currentY);
       for (int i = 0, n = s.length(); i < n; ++i) {
           switch (s.charAt(i)) {
               case 'F':
                   line(lineLength);
                   break;
               case '+':
                   turn(ANGLE);
                   break;
               case '-':
                   turn(-ANGLE);
                   break;
           }
       }
   }
   private void line(final double length) throws IOException {
       final double theta = (Math.PI * currentAngle) / 180.0;
       currentX += length * Math.cos(theta);
       currentY += length * Math.sin(theta);
       write("L%g,%g\n", currentX, currentY);
   }
   private void turn(final int angle) {
       currentAngle = (currentAngle + angle) % 360;
   }
   private void write(final String format, final Object... args) throws IOException {
       writer.write(String.format(format, args));
   }
   private static String rewrite(final int order) {
       String s = AXIOM;
       for (int i = 0; i < order; ++i) {
           final StringBuilder sb = new StringBuilder();
           for (int j = 0, n = s.length(); j < n; ++j) {
               final char ch = s.charAt(j);
               if (ch == 'X')
                   sb.append(PRODUCTION);
               else
                   sb.append(ch);
           }
           s = sb.toString();
       }
       return s;
   }
   private final Writer writer;
   private double lineLength;
   private double currentX;
   private double currentY;
   private int currentAngle;
   private static final String AXIOM = "F+XF+F+XF";
   private static final String PRODUCTION = "XF-F+F-XF+F+XF-F+F-X";
   private static final int ANGLE = 90;
}</lang>
- Output:
See: sierpinski_square.svg (offsite SVG image)
jq
Works with gojq, the Go implementation of jq
The program given here generates SVG code that can be viewed directly in a browser, at least if the file suffix is .svg.
See Simple Turtle Graphics for the simple-turtle.jq module used in this entry. The `include` statement assumes the file is in the pwd. <lang jq>include "simple-turtle" {search: "."};
def rules: {"X": "XF-F+F-XF+F+XF-F+F-X"};
def sierpinski($count):
 rules as $rules
 | def p($count):
     if $count <= 0 then .
     else gsub("X"; $rules["X"]) | p($count-1)
     end;
 "F+XF+F+XF" | p($count) ;
def interpret($x):
 if   $x == "+" then turtleRotate(90)
 elif $x == "-" then turtleRotate(-90)
 elif $x == "F" then turtleForward(5)
 else .
 end;
def sierpinski_curve($n):
 sierpinski($n)
 | split("")
 | reduce .[] as $action (turtle([200,650]) | turtleDown;
     interpret($action) ) ;
sierpinski_curve(5) | path("none"; "red"; 1) | svg(1000) </lang>
Julia
<lang julia>using Lindenmayer # https://github.com/cormullion/Lindenmayer.jl
scurve = LSystem(Dict("X" => "XF-F+F-XF+F+XF-F+F-X"), "F+XF+F+XF")
drawLSystem(scurve,
   forward = 3,
   turn = 90,
   startingy = -400,
   iterations = 6,
   filename = "sierpinski_square_curve.png",
   showpreview = true
) </lang>
Mathematica/Wolfram Language
<lang Mathematica>Graphics[SierpinskiCurve[3]]</lang>
- Output:
Outputs a graphical version of a 3rd order Sierpinski curve.
Nim
We produce a SVG file. <lang Nim>import math
type
 SierpinskiCurve = object
   x, y: float
   angle: float
   length: int
   file: File
proc line(sc: var SierpinskiCurve) =
 let theta = degToRad(sc.angle)
 sc.x += sc.length.toFloat * cos(theta)
 sc.y += sc.length.toFloat * sin(theta)
 sc.file.write " L", sc.x, ',', sc.y
proc execute(sc: var SierpinskiCurve; s: string) =
 sc.file.write 'M', sc.x, ',', sc.y
 for c in s:
   case c
   of 'F': sc.line()
   of '+': sc.angle = floorMod(sc.angle + 90, 360)
   of '-': sc.angle = floorMod(sc.angle - 90, 360)
   else: discard
func rewrite(s: string): string =
 for c in s:
   if c == 'X':
     result.add "XF-F+F-XF+F+XF-F+F-X"
   else:
     result.add c
proc write(sc: var SierpinskiCurve; size, length, order: int) =
 sc.length = length
 sc.x = (size - length) / 2
 sc.y = length.toFloat
 sc.angle = 0
 sc.file.write "<svg xmlns='http://www.w3.org/2000/svg' width='", size, "' height='", size, "'>\n"
 sc.file.write "<rect width='100%' height='100%' fill='white'/>\n"
 sc.file.write "<path stroke-width='1' stroke='black' fill='none' d='"
 var s = "F+XF+F+XF"
 for _ in 1..order: s = s.rewrite()
 sc.execute(s)
 sc.file.write "'/>\n</svg>\n"
let outfile = open("sierpinski_square.svg", fmWrite)
var sc = SierpinskiCurve(file: outfile)
sc.write(635, 5, 5)
outfile.close()</lang>
- Output:
Same as C++ output.
Perl
<lang perl>use strict; use warnings; use SVG; use List::Util qw(max min); use constant pi => 2 * atan2(1, 0);
my $rule = 'XF-F+F-XF+F+XF-F+F-X'; my $S = 'F+F+XF+F+XF'; $S =~ s/X/$rule/g for 1..5;
my (@X, @Y); my ($x, $y) = (0, 0); my $theta = pi/4; my $r = 6;
for (split //, $S) {
   if (/F/) {
       push @X, sprintf "%.0f", $x;
       push @Y, sprintf "%.0f", $y;
       $x += $r * cos($theta);
       $y += $r * sin($theta);
   }
   elsif (/\+/) { $theta += pi/2; }
   elsif (/\-/) { $theta -= pi/2; }
}
my ($xrng, $yrng) = ( max(@X) - min(@X), max(@Y) - min(@Y)); my ($xt, $yt) = (-min(@X) + 10, -min(@Y) + 10);
my $svg = SVG->new(width=>$xrng+20, height=>$yrng+20); my $points = $svg->get_path(x=>\@X, y=>\@Y, -type=>'polyline'); $svg->rect(width=>"100%", height=>"100%", style=>{'fill'=>'black'}); $svg->polyline(%$points, style=>{'stroke'=>'orange', 'stroke-width'=>1}, transform=>"translate($xt,$yt)");
open my $fh, '>', 'sierpinski-square-curve.svg'; print $fh $svg->xmlify(-namespace=>'svg'); close $fh;</lang> See: sierpinski-square-curve.svg (offsite SVG image)
Phix
You can run this online here.
--
-- demo\rosetta\Sierpinski_square_curve.exw
-- ========================================
--
-- My second atempt at a Lindenmayer system. The first
--  is now saved in demo\rosetta\Penrose_tiling.exw
--
with javascript_semantics
include pGUI.e

Ihandle dlg, canvas
cdCanvas cddbuffer, cdcanvas

function redraw_cb(Ihandle /*canvas*/)
    string s = "F+F+XF+F+XF"
    for n=1 to 4 do
        string next = ""
        for i=1 to length(s) do
            integer ch = s[i]
            next &= iff(ch='X'?"XF-F+F-XF+F+XF-F+F-X":ch)
        end for
        s = next
    end for

    cdCanvasActivate(cddbuffer)
    cdCanvasBegin(cddbuffer, CD_CLOSED_LINES)
    atom x=0, y=0, theta=PI/4, r = 6
    for i=1 to length(s) do
        integer ch = s[i]
        switch ch do
            case 'F':   x += r*cos(theta)
                        y += r*sin(theta)
                        cdCanvasVertex(cddbuffer, x+270, y+270)
            case '+':   theta += PI/2
            case '-':   theta -= PI/2
        end switch
    end for
    cdCanvasEnd(cddbuffer)
    cdCanvasFlush(cddbuffer)
    return IUP_DEFAULT
end function

function map_cb(Ihandle canvas)
    cdcanvas = cdCreateCanvas(CD_IUP, canvas)
    cddbuffer = cdCreateCanvas(CD_DBUFFER, cdcanvas)
    cdCanvasSetBackground(cddbuffer, CD_WHITE)
    cdCanvasSetForeground(cddbuffer, CD_BLUE)
    return IUP_DEFAULT
end function

IupOpen()
canvas = IupCanvas("RASTERSIZE=290x295")
IupSetCallbacks(canvas, {"MAP_CB", Icallback("map_cb"),
                         "ACTION", Icallback("redraw_cb")})
dlg = IupDialog(canvas,`TITLE="Sierpinski square curve"`)
IupSetAttribute(dlg,`DIALOGFRAME`,`YES`)
IupShow(dlg)
if platform()!=JS then
    IupMainLoop()
    IupClose()
end if
and an svg-creating version:
without js -- (file i/o)
constant rule = "XF-F+F-XF+F+XF-F+F-X"
string s = "F+F+XF+F+XF"
for n=1 to 4 do
    string next = ""
    for i=1 to length(s) do
        integer ch = s[i]
        next &= iff(ch='X'?rule:ch)
    end for
    s = next
end for

sequence X = {}, Y= {}
atom x=0, y=0, theta=PI/4, r = 6
string svg = ""
for i=1 to length(s) do
    integer ch = s[i]
    switch ch do
        case 'F':   X &= x; x += r*cos(theta)
                    Y &= y; y += r*sin(theta)
        case '+':   theta += PI/2
        case '-':   theta -= PI/2
    end switch
end for
constant svgfmt = """
<svg xmlns="http://www.w3.org/2000/svg" height="%d" width="%d">
 <rect height="100%%" width="100%%" style="fill:black" />
 <polyline points="%s" style="stroke: orange; stroke-width: 1" transform="translate(%d,%d)" />
</svg>"""
string points = ""
for i=1 to length(X) do
    points &= sprintf("%.2f,%.2f ",{X[i],Y[i]})
end for
integer fn = open("sierpinski_square_curve.svg","w")
atom xt = -min(X)+10,
     yt = -min(Y)+10
printf(fn,svgfmt,{max(X)+xt+10,max(Y)+yt+10,points,xt,yt})
close(fn)
Python
<lang Python>import matplotlib.pyplot as plt import math
def nextPoint(x, y, angle):
   a = math.pi * angle / 180
   x2 = (int)(round(x + (1 * math.cos(a))))
   y2 = (int)(round(y + (1 * math.sin(a))))
   return x2, y2
def expand(axiom, rules, level):
   for l in range(0, level):
       a2 = ""
       for c in axiom:
           if c in rules:
               a2 += rules[c]
           else:
               a2 += c
       axiom = a2
   return axiom
def draw_lsystem(axiom, rules, angle, iterations):
   xp = [1]
   yp = [1]
   direction = 0
   for c in expand(axiom, rules, iterations):
       if c == "F":
           xn, yn = nextPoint(xp[-1], yp[-1], direction)
           xp.append(xn)
           yp.append(yn)
       elif c == "-":
           direction = direction - angle
           if direction < 0:
               direction = 360 + direction
       elif c == "+":
           direction = (direction + angle) % 360
   plt.plot(xp, yp)
   plt.show()
if __name__ == '__main__':
   # Sierpinski Square L-System Definition
   s_axiom = "F+XF+F+XF"
   s_rules = {"X": "XF-F+F-XF+F+XF-F+F-X"}
   s_angle = 90
draw_lsystem(s_axiom, s_rules, s_angle, 3)</lang>
Quackery
<lang Quackery> [ $ "turtleduck.qky" loadfile ] now!
 [ stack ]                      is switch.arg (   --> [ )

 [ switch.arg put ]             is switch     ( x -->   )

 [ switch.arg release ]         is otherwise  (   -->   )

 [ switch.arg share
   != iff ]else[ done
   otherwise ]'[ do ]done[ ]    is case       ( x -->   )

 [ $ "" swap witheach
     [ nested quackery join ] ] is expand     ( $ --> $ )

 [ $ "L" ]                      is L          ( $ --> $ )

 [ $ "R" ]                      is R          ( $ --> $ )

 [ $ "F" ]                      is F          ( $ --> $ )

 [ $ "AFRFLFRAFLFLAFRFLFRA" ]   is A          ( $ --> $ )

 $ "FLAFLFLAF"

 4 times expand

 turtle
 witheach
   [ switch
       [ char L case [ -1 4 turn ]
         char R case [  1 4 turn ]
         char F case [  5 1 walk ]
         otherwise ( ignore ) ] ]</lang>
- Output:
Raku
(formerly Perl 6)
<lang perl6>use SVG;
role Lindenmayer {
   has %.rules;
   method succ {
       self.comb.map( { %!rules{$^c} // $c } ).join but Lindenmayer(%!rules)
   }
}
my $sierpinski = 'X' but Lindenmayer( { X => 'XF-F+F-XF+F+XF-F+F-X' } );
$sierpinski++ xx 5;
my $dim = 600; my $scale = 6;
my @points = (-80, 298);
for $sierpinski.comb {
   state ($x, $y) = @points[0,1];
   state $d = $scale + 0i;
   when 'F' { @points.append: ($x += $d.re).round(1), ($y += $d.im).round(1) }
   when /< + - >/ { $d *= "{$_}1i" }
   default { }
}
my @t = @points.tail(2).clone;
my $out = './sierpinski-square-curve-perl6.svg'.IO;
$out.spurt: SVG.serialize(
   svg => [
       :width($dim), :height($dim),
       :rect[:width<100%>, :height<100%>, :fill<black>],
       :polyline[
         :points((@points, map {(@t »+=» $_).clone}, ($scale,0), (0,$scale), (-$scale,0)).join: ','),
         :fill<black>, :transform("rotate(45, 300, 300)"), :style<stroke:#61D4FF>,
       ],
       :polyline[
         :points(@points.map( -> $x,$y { $x, $dim - $y + 1 }).join: ','),
         :fill<black>, :transform("rotate(45, 300, 300)"), :style<stroke:#61D4FF>,
       ],
   ],
);</lang> See: Sierpinski-square-curve-perl6.svg (offsite SVG image)
Rust
Program output is a file in SVG format. <lang rust>// [dependencies] // svg = "0.8.0"
use svg::node::element::path::Data; use svg::node::element::Path;
struct SierpinskiSquareCurve {
   current_x: f64,
   current_y: f64,
   current_angle: i32,
   line_length: f64,
}
impl SierpinskiSquareCurve {
   fn new(x: f64, y: f64, length: f64, angle: i32) -> SierpinskiSquareCurve {
       SierpinskiSquareCurve {
           current_x: x,
           current_y: y,
           current_angle: angle,
           line_length: length,
       }
   }
   fn rewrite(order: usize) -> String {
       let mut str = String::from("F+XF+F+XF");
       for _ in 0..order {
           let mut tmp = String::new();
           for ch in str.chars() {
               match ch {
                   'X' => tmp.push_str("XF-F+F-XF+F+XF-F+F-X"),
                   _ => tmp.push(ch),
               }
           }
           str = tmp;
       }
       str
   }
   fn execute(&mut self, order: usize) -> Path {
       let mut data = Data::new().move_to((self.current_x, self.current_y));
       for ch in SierpinskiSquareCurve::rewrite(order).chars() {
           match ch {
               'F' => data = self.draw_line(data),
               '+' => self.turn(90),
               '-' => self.turn(-90),
               _ => {}
           }
       }
       Path::new()
           .set("fill", "none")
           .set("stroke", "black")
           .set("stroke-width", "1")
           .set("d", data)
   }
   fn draw_line(&mut self, data: Data) -> Data {
       let theta = (self.current_angle as f64).to_radians();
       self.current_x += self.line_length * theta.cos();
       self.current_y += self.line_length * theta.sin();
       data.line_to((self.current_x, self.current_y))
   }
   fn turn(&mut self, angle: i32) {
       self.current_angle = (self.current_angle + angle) % 360;
   }
   fn save(file: &str, size: usize, length: f64, order: usize) -> std::io::Result<()> {
       use svg::node::element::Rectangle;
       let x = (size as f64 - length) / 2.0;
       let y = length;
       let rect = Rectangle::new()
           .set("width", "100%")
           .set("height", "100%")
           .set("fill", "white");
       let mut s = SierpinskiSquareCurve::new(x, y, length, 0);
       let document = svg::Document::new()
           .set("width", size)
           .set("height", size)
           .add(rect)
           .add(s.execute(order));
       svg::save(file, &document)
   }
}
fn main() {
SierpinskiSquareCurve::save("sierpinski_square_curve.svg", 635, 5.0, 5).unwrap();
}</lang>
- Output:
See: sierpinski_square_curve.svg (offsite SVG image)
Sidef
Uses the LSystem() class from Hilbert curve. <lang ruby>var rules = Hash(
x => 'xF-F+F-xF+F+xF-F+F-x',
)
var lsys = LSystem(
   width:  510,
   height: 510,
   xoff: -505,
   yoff: -254,
   len:   4,
   angle: 90,
   color: 'dark green',
)
lsys.execute('F+xF+F+xF', 5, "sierpiński_square_curve.png", rules)</lang> Output image: Sierpiński square curve
VBScript
Output to html (svg) displayed in the default browser. A turtle graphics class helps to keep the curve definition simple <lang vb>
option explicit 'outputs turtle graphics to svg file and opens it
const pi180= 0.01745329251994329576923690768489 ' pi/180 const pi=3.1415926535897932384626433832795 'pi class turtle
  dim fso
  dim fn
  dim svg

  dim iang  'radians
  dim ori   'radians
  dim incr
  dim pdown
  dim clr
  dim x
  dim y
  public property let orient(n):ori = n*pi180 :end property
  public property let iangle(n):iang= n*pi180 :end property
  public sub pd() : pdown=true: end sub
  public sub pu()  :pdown=FALSE :end sub

  public sub rt(i)
    ori=ori - i*iang:
    'if ori<0 then ori = ori+pi*2
  end sub
  public sub lt(i):
    ori=(ori + i*iang)
    'if ori>(pi*2) then ori=ori-pi*2
  end sub

  public sub bw(l)
     x= x+ cos(ori+pi)*l*incr
     y= y+ sin(ori+pi)*l*incr
    ' ori=ori+pi '?????
  end sub

  public sub fw(l)
     dim x1,y1
     x1=x + cos(ori)*l*incr
     y1=y + sin(ori)*l*incr
     if pdown then line x,y,x1,y1
     x=x1:y=y1
  end sub

  Private Sub Class_Initialize()
     setlocale "us"
     initsvg
     x=400:y=400:incr=100
     ori=90*pi180
     iang=90*pi180
     clr=0
     pdown=true
  end sub

  Private Sub Class_Terminate()
     disply
  end sub

  private sub line (x,y,x1,y1)
     svg.WriteLine "<line x1=""" & x & """ y1= """& y & """ x2=""" & x1& """ y2=""" & y1 & """/>"
  end sub
  private sub disply()
      dim shell
      svg.WriteLine "</svg></body></html>"
      svg.close
      Set shell = CreateObject("Shell.Application")
      shell.ShellExecute fn,1,False
  end sub
  private sub initsvg()
    dim scriptpath
    Set fso = CreateObject ("Scripting.Filesystemobject")
    ScriptPath= Left(WScript.ScriptFullName, InStrRev(WScript.ScriptFullName, "\"))
    fn=Scriptpath & "SIERP.HTML"
    Set svg = fso.CreateTextFile(fn,True)
    if SVG IS nothing then wscript.echo "Can't create svg file" :vscript.quit
    svg.WriteLine "<!DOCTYPE html>" &vbcrlf & "<html>" &vbcrlf & "<head>"
    svg.writeline "<style>" & vbcrlf & "line {stroke:rgb(255,0,0);stroke-width:.5}" &vbcrlf &"</style>"
    svg.writeline "</head>"&vbcrlf & "<body>"
    svg.WriteLine "<svg xmlns=""http://www.w3.org/2000/svg"" width=""800"" height=""800"" viewBox=""0 0 800 800"">"
  end sub
end class
'to half.sierpinski :size :level ' if :level = 0 [forward :size stop] ' half.sierpinski :size :level - 1 ' left 45 ' forward :size * sqrt 2 ' left 45 ' half.sierpinski :size :level - 1 ' right 90 ' forward :size ' right 90 ' half.sierpinski :size :level - 1 ' left 45 ' forward :size * sqrt 2 ' left 45 ' half.sierpinski :size :level - 1 'end const raiz2=1.4142135623730950488016887242097 sub media_sierp (niv,sz)
  if niv=0 then x.fw sz: exit sub
  media_sierp niv-1,sz
  x.lt 1
  x.fw sz*raiz2
  x.lt 1
   media_sierp niv-1,sz
  x.rt 2
  x.fw sz
  x.rt 2
 media_sierp niv-1,sz
  x.lt 1
  x.fw sz*raiz2
  x.lt 1
   media_sierp niv-1,sz
end sub
'to sierpinski :size :level ' half.sierpinski :size :level ' right 90 ' forward :size ' right 90 ' half.sierpinski :size :level ' right 90 ' forward :size ' right 90 'end
sub sierp(niv,sz)
  media_sierp niv,sz
  x.rt 2
  x.fw sz
  x.rt 2
  media_sierp niv,sz
  x.rt 2
  x.fw sz
  x.rt 2
end sub
dim x set x=new turtle x.iangle=45 x.orient=0 x.incr=1 x.x=100:x.y=270 'star5 sierp 5,4 set x=nothing </lang>
Wren
<lang ecmascript>import "graphics" for Canvas, Color import "dome" for Window import "math" for Math import "./lsystem" for LSystem, Rule
var TwoPi = Num.pi * 2
class SierpinskiSquareCurve {
   construct new(width, height, back, fore) {
       Window.title = "Sierpinski Square Curve"
       Window.resize(width, height)
       Canvas.resize(width, height)
       _w = width
       _h = height
       _bc = back
       _fc = fore
   }
   init() {
       Canvas.cls(_bc)
       var cx = 10
       var cy = (_h/2).floor + 5
       var theta = 0
       var h = 6
       var lsys = LSystem.new(
           ["X"],                                    //  variables
           ["F", "+", "-"],                          //  constants
           "F+XF+F+XF",                              //  axiom
           [Rule.new("X", "XF-F+F-XF+F+XF-F+F-X")],  //  rules
           Num.pi / 2                                //  angle (90 degrees in radians)
       )
       var result = lsys.iterate(5)
       var operations = {
           "F": Fn.new {
               var newX = cx + h*Math.sin(theta)
               var newY = cy - h*Math.cos(theta)
               Canvas.line(cx, cy, newX, newY, _fc, 2)
               cx = newX
               cy = newY
           },
           "+": Fn.new {
               theta = (theta + lsys.angle) % TwoPi
           },
           "-": Fn.new {
               theta = (theta - lsys.angle) % TwoPi
           }
       }
       LSystem.execute(result, operations)
   }
update() {}
draw(alpha) {}
}
var Game = SierpinskiSquareCurve.new(770, 770, Color.blue, Color.yellow)</lang>
zkl
Uses Image Magick and the PPM class from http://rosettacode.org/wiki/Bitmap/Bresenham%27s_line_algorithm#zkl <lang zkl>sierpinskiSquareCurve(4) : turtle(_);
fcn sierpinskiSquareCurve(n){ // Lindenmayer system --> Data of As
  var [const] A="AF-F+F-AF+F+AF-F+F-A", B="";  // Production rules
  var [const] Axiom="F+AF+F+AF";
  buf1,buf2 := Data(Void,Axiom).howza(3), Data().howza(3);  // characters
  do(n){
     buf1.pump(buf2.clear(),fcn(c){ if(c=="A") A else if(c=="B") B else c });
     t:=buf1; buf1=buf2; buf2=t;	// swap buffers
  }
  buf1		// n=4 --> 3,239 characters
}
fcn turtle(curve){ // a "square" turtle, directions are +-90*
  const D=10;
  ds,dir := T( T(D,0), T(0,-D), T(-D,0), T(0,D) ), 2; // turtle offsets
  dx,dy := ds[dir];
  img,color := PPM(650,650), 0x00ff00;  // green on black
  x,y := img.w/2, 10;
  curve.replace("A","").replace("B","");  // A & B are no-op during drawing
  foreach c in (curve){
     switch(c){
case("F"){ img.line(x,y, (x+=dx),(y+=dy), color) } // draw forward case("+"){ dir=(dir+1)%4; dx,dy = ds[dir] } // turn right 90* case("-"){ dir=(dir-1)%4; dx,dy = ds[dir] } // turn left 90*
     }
  }
  img.writeJPGFile("sierpinskiSquareCurve.zkl.jpg");
}</lang>
- Output:
Offsite image at Sierpinski square curve of order 4