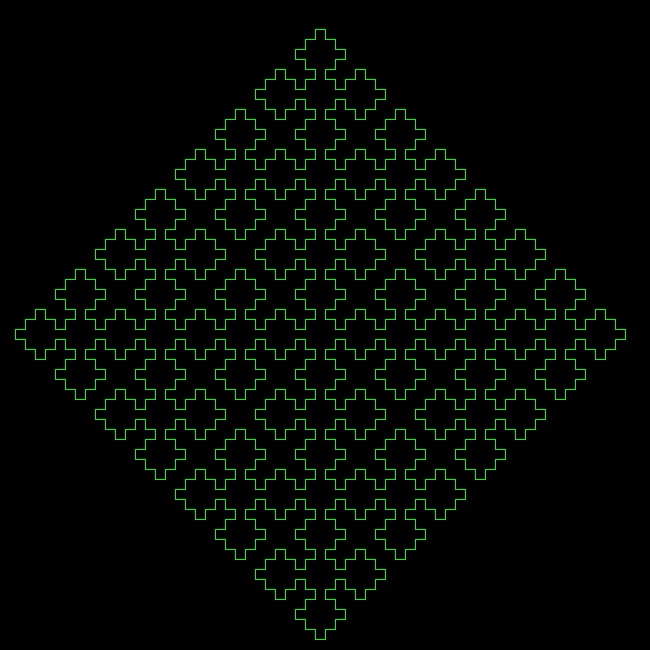
Sierpinski square curve
Produce a graphical or ASCII-art representation of a Sierpinski square curve of at least order 3.

You are encouraged to solve this task according to the task description, using any language you may know.
- Task
11l
<lang 11l>F sierpinski_square(fname, size, length, order)
  V x = (size - length) / 2
  V y = Float(length)
  V angle = 0.0
  V outfile = File(fname, ‘w’)
  outfile.write(‘<svg xmlns='http://www.w3.org/2000/svg' width='’size‘' height='’size"'>\n")
  outfile.write("<rect width='100%' height='100%' fill='white'/>\n")
  outfile.write(‘<path stroke-width='1' stroke='black' fill='none' d='’)
  V s = ‘F+XF+F+XF’
  L 0 .< order
     s = s.replace(‘X’, ‘XF-F+F-XF+F+XF-F+F-X’)
  outfile.write(‘M’x‘,’y)
  L(c) s
     S c
        ‘F’
           x += length * cos(radians(angle))
           y += length * sin(radians(angle))
           outfile.write(‘ L’x‘,’y)
        ‘+’
           angle = (angle + 90) % 360
        ‘-’
           angle = (angle - 90 + 360) % 360
outfile.write("'/>\n</svg>\n")
sierpinski_square(‘sierpinski_square.svg’, 635, 5, 5)</lang>
- Output:
Output is similar to C++.
C++
Output is a file in SVG format. <lang cpp>// See https://en.wikipedia.org/wiki/Sierpi%C5%84ski_curve#Representation_as_Lindenmayer_system
- include <cmath>
- include <fstream>
- include <iostream>
- include <string>
class sierpinski_square { public:
void write(std::ostream& out, int size, int length, int order);
private:
   static std::string rewrite(const std::string& s);
   void line(std::ostream& out);
   void execute(std::ostream& out, const std::string& s);
   double x_;
   double y_;
   int angle_;
   int length_;
};
void sierpinski_square::write(std::ostream& out, int size, int length, int order) {
   length_ = length;
   x_ = (size - length)/2;
   y_ = length;
   angle_ = 0;
   out << "<svg xmlns='http://www.w3.org/2000/svg' width='"
       << size << "' height='" << size << "'>\n";
   out << "<rect width='100%' height='100%' fill='white'/>\n";
   out << "<path stroke-width='1' stroke='black' fill='none' d='";
   std::string s = "F+XF+F+XF";
   for (int i = 0; i < order; ++i)
       s = rewrite(s);
   execute(out, s);
   out << "'/>\n</svg>\n";
}
std::string sierpinski_square::rewrite(const std::string& s) {
   std::string t;
   for (char c : s) {
       if (c == 'X')
           t += "XF-F+F-XF+F+XF-F+F-X";
       else
           t += c;
   }
   return t;
}
void sierpinski_square::line(std::ostream& out) {
   double theta = (3.14159265359 * angle_)/180.0;
   x_ += length_ * std::cos(theta);
   y_ += length_ * std::sin(theta);
   out << " L" << x_ << ',' << y_;
}
void sierpinski_square::execute(std::ostream& out, const std::string& s) {
   out << 'M' << x_ << ',' << y_;
   for (char c : s) {
       switch (c) {
       case 'F':
           line(out);
           break;
       case '+':
           angle_ = (angle_ + 90) % 360;
           break;
       case '-':
           angle_ = (angle_ - 90) % 360;
           break;
       }
   }
}
int main() {
   std::ofstream out("sierpinski_square.svg");
   if (!out) {
       std::cerr << "Cannot open output file\n";
       return 1;
   }
   sierpinski_square s;
   s.write(out, 635, 5, 5);
   return 0;
}</lang>
- Output:
See: sierpinski_square.svg (offsite SVG image)
Factor
<lang factor>USING: accessors kernel L-system sequences ui ;
- square-curve ( L-system -- L-system )
   L-parser-dialect >>commands
   [ 90 >>angle ] >>turtle-values
   "F+XF+F+XF" >>axiom
   {
       { "X" "XF-F+F-XF+F+XF-F+F-X" }
   } >>rules ;
[
   <L-system> square-curve
   "Sierpinski square curve" open-window
] with-ui</lang>
When using the L-system visualizer, the following controls apply:
| Button | Command |
|---|---|
| a | zoom in |
| z | zoom out |
| left arrow | turn left |
| right arrow | turn right |
| up arrow | pitch down |
| down arrow | pitch up |
| q | roll left |
| w | roll right |
| Button | Command |
|---|---|
| x | iterate L-system |
Go
The following uses the Lindenmayer system with the appropriate parameters from the Wikipedia article and produces a similar image (apart from the colors, yellow on blue) to the Sidef and zkl entries. <lang go>package main
import (
   "github.com/fogleman/gg"
   "github.com/trubitsyn/go-lindenmayer"
   "log"
   "math"
)
const twoPi = 2 * math.Pi
var (
   width  = 770.0
   height = 770.0
   dc     = gg.NewContext(int(width), int(height))
)
var cx, cy, h, theta float64
func main() {
   dc.SetRGB(0, 0, 1) // blue background
   dc.Clear()
   cx, cy = 10, height/2+5
   h = 6
   sys := lindenmayer.Lsystem{
       Variables: []rune{'X'},
       Constants: []rune{'F', '+', '-'},
       Axiom:     "F+XF+F+XF",
       Rules: []lindenmayer.Rule{
           {"X", "XF-F+F-XF+F+XF-F+F-X"},
       },
       Angle: math.Pi / 2, // 90 degrees in radians
   }
   result := lindenmayer.Iterate(&sys, 5)
   operations := map[rune]func(){
       'F': func() {
           newX, newY := cx+h*math.Sin(theta), cy-h*math.Cos(theta)
           dc.LineTo(newX, newY)
           cx, cy = newX, newY
       },
       '+': func() {
           theta = math.Mod(theta+sys.Angle, twoPi)
       },
       '-': func() {
           theta = math.Mod(theta-sys.Angle, twoPi)
       },
   }
   if err := lindenmayer.Process(result, operations); err != nil {
       log.Fatal(err)
   }
   // needed to close the square at the extreme left
   operations['+']()
   operations['F']()
   // create the image and save it
   dc.SetRGB255(255, 255, 0) // yellow curve
   dc.SetLineWidth(2)
   dc.Stroke()
   dc.SavePNG("sierpinski_square_curve.png")
}</lang>
J
It looks like there's two different (though similar) concepts implemented here, of what a "Sierpinski square curve" looks like. And, the wikipedia writeup is remarkably obtuse about some of the details of the structure. And, we've got some dead links here. So, for now, a quickie ascii art implementation:<lang J> 1j1#"1' #'{~{{l,(1,~0{.~#y),l=.y,.0,.y}}^:3,.1
- # # # # # # #
# # # #
- # # # # # # #
# #
- # # # # # # #
# # # #
- # # # # # # #
#
- # # # # # # #
# # # #
- # # # # # # #
# #
- # # # # # # #
# # # #
- # # # # # # # </lang>
Java
<lang java>import java.io.*;
public class SierpinskiSquareCurve {
   public static void main(final String[] args) {
       try (Writer writer = new BufferedWriter(new FileWriter("sierpinski_square.svg"))) {
           SierpinskiSquareCurve s = new SierpinskiSquareCurve(writer);
           int size = 635, length = 5;
           s.currentAngle = 0;
           s.currentX = (size - length)/2;
           s.currentY = length;
           s.lineLength = length;
           s.begin(size);
           s.execute(rewrite(5));
           s.end();
       } catch (final Exception ex) {
           ex.printStackTrace();
       }
   }
   private SierpinskiSquareCurve(final Writer writer) {
       this.writer = writer;
   }
   private void begin(final int size) throws IOException {
       write("<svg xmlns='http://www.w3.org/2000/svg' width='%d' height='%d'>\n", size, size);
       write("<rect width='100%%' height='100%%' fill='white'/>\n");
       write("<path stroke-width='1' stroke='black' fill='none' d='");
   }
   private void end() throws IOException {
       write("'/>\n</svg>\n");
   }
   private void execute(final String s) throws IOException {
       write("M%g,%g\n", currentX, currentY);
       for (int i = 0, n = s.length(); i < n; ++i) {
           switch (s.charAt(i)) {
               case 'F':
                   line(lineLength);
                   break;
               case '+':
                   turn(ANGLE);
                   break;
               case '-':
                   turn(-ANGLE);
                   break;
           }
       }
   }
   private void line(final double length) throws IOException {
       final double theta = (Math.PI * currentAngle) / 180.0;
       currentX += length * Math.cos(theta);
       currentY += length * Math.sin(theta);
       write("L%g,%g\n", currentX, currentY);
   }
   private void turn(final int angle) {
       currentAngle = (currentAngle + angle) % 360;
   }
   private void write(final String format, final Object... args) throws IOException {
       writer.write(String.format(format, args));
   }
   private static String rewrite(final int order) {
       String s = AXIOM;
       for (int i = 0; i < order; ++i) {
           final StringBuilder sb = new StringBuilder();
           for (int j = 0, n = s.length(); j < n; ++j) {
               final char ch = s.charAt(j);
               if (ch == 'X')
                   sb.append(PRODUCTION);
               else
                   sb.append(ch);
           }
           s = sb.toString();
       }
       return s;
   }
   private final Writer writer;
   private double lineLength;
   private double currentX;
   private double currentY;
   private int currentAngle;
   private static final String AXIOM = "F+XF+F+XF";
   private static final String PRODUCTION = "XF-F+F-XF+F+XF-F+F-X";
   private static final int ANGLE = 90;
}</lang>
- Output:
See: sierpinski_square.svg (offsite SVG image)
jq
Works with gojq, the Go implementation of jq
The program given here generates SVG code that can be viewed directly in a browser, at least if the file suffix is .svg.
See Simple Turtle Graphics for the simple-turtle.jq module used in this entry. The `include` statement assumes the file is in the pwd. <lang jq>include "simple-turtle" {search: "."};
def rules: {"X": "XF-F+F-XF+F+XF-F+F-X"};
def sierpinski($count):
 rules as $rules
 | def p($count):
     if $count <= 0 then .
     else gsub("X"; $rules["X"]) | p($count-1)
     end;
 "F+XF+F+XF" | p($count) ;
def interpret($x):
 if   $x == "+" then turtleRotate(90)
 elif $x == "-" then turtleRotate(-90)
 elif $x == "F" then turtleForward(5)
 else .
 end;
def sierpinski_curve($n):
 sierpinski($n)
 | split("")
 | reduce .[] as $action (turtle([200,650]) | turtleDown;
     interpret($action) ) ;
sierpinski_curve(5) | path("none"; "red"; 1) | svg(1000) </lang>
Julia
<lang julia>using Lindenmayer # https://github.com/cormullion/Lindenmayer.jl
scurve = LSystem(Dict("X" => "XF-F+F-XF+F+XF-F+F-X"), "F+XF+F+XF")
drawLSystem(scurve,
   forward = 3,
   turn = 90,
   startingy = -400,
   iterations = 6,
   filename = "sierpinski_square_curve.png",
   showpreview = true
) </lang>
Mathematica/Wolfram Language
<lang Mathematica>Graphics[SierpinskiCurve[3]]</lang>
- Output:
Outputs a graphical version of a 3rd order Sierpinski curve.
Nim
We produce a SVG file. <lang Nim>import math
type
 SierpinskiCurve = object
   x, y: float
   angle: float
   length: int
   file: File
proc line(sc: var SierpinskiCurve) =
 let theta = degToRad(sc.angle)
 sc.x += sc.length.toFloat * cos(theta)
 sc.y += sc.length.toFloat * sin(theta)
 sc.file.write " L", sc.x, ',', sc.y
proc execute(sc: var SierpinskiCurve; s: string) =
 sc.file.write 'M', sc.x, ',', sc.y
 for c in s:
   case c
   of 'F': sc.line()
   of '+': sc.angle = floorMod(sc.angle + 90, 360)
   of '-': sc.angle = floorMod(sc.angle - 90, 360)
   else: discard
func rewrite(s: string): string =
 for c in s:
   if c == 'X':
     result.add "XF-F+F-XF+F+XF-F+F-X"
   else:
     result.add c
proc write(sc: var SierpinskiCurve; size, length, order: int) =
 sc.length = length
 sc.x = (size - length) / 2
 sc.y = length.toFloat
 sc.angle = 0
 sc.file.write "<svg xmlns='http://www.w3.org/2000/svg' width='", size, "' height='", size, "'>\n"
 sc.file.write "<rect width='100%' height='100%' fill='white'/>\n"
 sc.file.write "<path stroke-width='1' stroke='black' fill='none' d='"
 var s = "F+XF+F+XF"
 for _ in 1..order: s = s.rewrite()
 sc.execute(s)
 sc.file.write "'/>\n</svg>\n"
let outfile = open("sierpinski_square.svg", fmWrite)
var sc = SierpinskiCurve(file: outfile)
sc.write(635, 5, 5)
outfile.close()</lang>
- Output:
Same as C++ output.
Perl
<lang perl>use strict; use warnings; use SVG; use List::Util qw(max min); use constant pi => 2 * atan2(1, 0);
my $rule = 'XF-F+F-XF+F+XF-F+F-X'; my $S = 'F+F+XF+F+XF'; $S =~ s/X/$rule/g for 1..5;
my (@X, @Y); my ($x, $y) = (0, 0); my $theta = pi/4; my $r = 6;
for (split //, $S) {
   if (/F/) {
       push @X, sprintf "%.0f", $x;
       push @Y, sprintf "%.0f", $y;
       $x += $r * cos($theta);
       $y += $r * sin($theta);
   }
   elsif (/\+/) { $theta += pi/2; }
   elsif (/\-/) { $theta -= pi/2; }
}
my ($xrng, $yrng) = ( max(@X) - min(@X), max(@Y) - min(@Y)); my ($xt, $yt) = (-min(@X) + 10, -min(@Y) + 10);
my $svg = SVG->new(width=>$xrng+20, height=>$yrng+20); my $points = $svg->get_path(x=>\@X, y=>\@Y, -type=>'polyline'); $svg->rect(width=>"100%", height=>"100%", style=>{'fill'=>'black'}); $svg->polyline(%$points, style=>{'stroke'=>'orange', 'stroke-width'=>1}, transform=>"translate($xt,$yt)");
open my $fh, '>', 'sierpinski-square-curve.svg'; print $fh $svg->xmlify(-namespace=>'svg'); close $fh;</lang> See: sierpinski-square-curve.svg (offsite SVG image)
Phix
You can run this online here.
--
-- demo\rosetta\Sierpinski_square_curve.exw
-- ========================================
--
-- My second atempt at a Lindenmayer system. The first
--  is now saved in demo\rosetta\Penrose_tiling.exw
--
with javascript_semantics
include pGUI.e

Ihandle dlg, canvas
cdCanvas cddbuffer, cdcanvas

function redraw_cb(Ihandle /*canvas*/)
    string s = "F+F+XF+F+XF"
    for n=1 to 4 do
        string next = ""
        for i=1 to length(s) do
            integer ch = s[i]
            next &= iff(ch='X'?"XF-F+F-XF+F+XF-F+F-X":ch)
        end for
        s = next
    end for

    cdCanvasActivate(cddbuffer)
    cdCanvasBegin(cddbuffer, CD_CLOSED_LINES)
    atom x=0, y=0, theta=PI/4, r = 6
    for i=1 to length(s) do
        integer ch = s[i]
        switch ch do
            case 'F':   x += r*cos(theta)
                        y += r*sin(theta)
                        cdCanvasVertex(cddbuffer, x+270, y+270)
            case '+':   theta += PI/2
            case '-':   theta -= PI/2
        end switch
    end for
    cdCanvasEnd(cddbuffer)
    cdCanvasFlush(cddbuffer)
    return IUP_DEFAULT
end function

function map_cb(Ihandle canvas)
    cdcanvas = cdCreateCanvas(CD_IUP, canvas)
    cddbuffer = cdCreateCanvas(CD_DBUFFER, cdcanvas)
    cdCanvasSetBackground(cddbuffer, CD_WHITE)
    cdCanvasSetForeground(cddbuffer, CD_BLUE)
    return IUP_DEFAULT
end function

IupOpen()
canvas = IupCanvas("RASTERSIZE=290x295")
IupSetCallbacks(canvas, {"MAP_CB", Icallback("map_cb"),
                         "ACTION", Icallback("redraw_cb")})
dlg = IupDialog(canvas,`TITLE="Sierpinski square curve"`)
IupSetAttribute(dlg,`DIALOGFRAME`,`YES`)
IupShow(dlg)
if platform()!=JS then
    IupMainLoop()
    IupClose()
end if
and an svg-creating version:
without js -- (file i/o)
constant rule = "XF-F+F-XF+F+XF-F+F-X"
string s = "F+F+XF+F+XF"
for n=1 to 4 do
    string next = ""
    for i=1 to length(s) do
        integer ch = s[i]
        next &= iff(ch='X'?rule:ch)
    end for
    s = next
end for

sequence X = {}, Y= {}
atom x=0, y=0, theta=PI/4, r = 6
string svg = ""
for i=1 to length(s) do
    integer ch = s[i]
    switch ch do
        case 'F':   X &= x; x += r*cos(theta)
                    Y &= y; y += r*sin(theta)
        case '+':   theta += PI/2
        case '-':   theta -= PI/2
    end switch
end for
constant svgfmt = """
<svg xmlns="http://www.w3.org/2000/svg" height="%d" width="%d">
 <rect height="100%%" width="100%%" style="fill:black" />
 <polyline points="%s" style="stroke: orange; stroke-width: 1" transform="translate(%d,%d)" />
</svg>"""
string points = ""
for i=1 to length(X) do
    points &= sprintf("%.2f,%.2f ",{X[i],Y[i]})
end for
integer fn = open("sierpinski_square_curve.svg","w")
atom xt = -min(X)+10,
     yt = -min(Y)+10
printf(fn,svgfmt,{max(X)+xt+10,max(Y)+yt+10,points,xt,yt})
close(fn)
Python
<lang Python>import matplotlib.pyplot as plt import math
def nextPoint(x, y, angle):
   a = math.pi * angle / 180
   x2 = (int)(round(x + (1 * math.cos(a))))
   y2 = (int)(round(y + (1 * math.sin(a))))
   return x2, y2
def expand(axiom, rules, level):
   for l in range(0, level):
       a2 = ""
       for c in axiom:
           if c in rules:
               a2 += rules[c]
           else:
               a2 += c
       axiom = a2
   return axiom
def draw_lsystem(axiom, rules, angle, iterations):
   xp = [1]
   yp = [1]
   direction = 0
   for c in expand(axiom, rules, iterations):
       if c == "F":
           xn, yn = nextPoint(xp[-1], yp[-1], direction)
           xp.append(xn)
           yp.append(yn)
       elif c == "-":
           direction = direction - angle
           if direction < 0:
               direction = 360 + direction
       elif c == "+":
           direction = (direction + angle) % 360
   plt.plot(xp, yp)
   plt.show()
if __name__ == '__main__':
   # Sierpinski Square L-System Definition
   s_axiom = "F+XF+F+XF"
   s_rules = {"X": "XF-F+F-XF+F+XF-F+F-X"}
   s_angle = 90
draw_lsystem(s_axiom, s_rules, s_angle, 3)</lang>
Quackery
<lang Quackery> [ $ "turtleduck.qky" loadfile ] now!
 [ stack ]                      is switch.arg (   --> [ )

 [ switch.arg put ]             is switch     ( x -->   )

 [ switch.arg release ]         is otherwise  (   -->   )

 [ switch.arg share
   != iff ]else[ done
   otherwise ]'[ do ]done[ ]    is case       ( x -->   )

 [ $ "" swap witheach
     [ nested quackery join ] ] is expand     ( $ --> $ )

 [ $ "L" ]                      is L          ( $ --> $ )

 [ $ "R" ]                      is R          ( $ --> $ )

 [ $ "F" ]                      is F          ( $ --> $ )

 [ $ "AFRFLFRAFLFLAFRFLFRA" ]   is A          ( $ --> $ )

 $ "FLAFLFLAF"

 4 times expand

 turtle
 witheach
   [ switch
       [ char L case [ -1 4 turn ]
         char R case [  1 4 turn ]
         char F case [  5 1 walk ]
         otherwise ( ignore ) ] ]</lang>
- Output:
Raku
(formerly Perl 6)
<lang perl6>use SVG;
role Lindenmayer {
   has %.rules;
   method succ {
       self.comb.map( { %!rules{$^c} // $c } ).join but Lindenmayer(%!rules)
   }
}
my $sierpinski = 'X' but Lindenmayer( { X => 'XF-F+F-XF+F+XF-F+F-X' } );
$sierpinski++ xx 5;
my $dim = 600; my $scale = 6;
my @points = (-80, 298);
for $sierpinski.comb {
   state ($x, $y) = @points[0,1];
   state $d = $scale + 0i;
   when 'F' { @points.append: ($x += $d.re).round(1), ($y += $d.im).round(1) }
   when /< + - >/ { $d *= "{$_}1i" }
   default { }
}
my @t = @points.tail(2).clone;
my $out = './sierpinski-square-curve-perl6.svg'.IO;
$out.spurt: SVG.serialize(
   svg => [
       :width($dim), :height($dim),
       :rect[:width<100%>, :height<100%>, :fill<black>],
       :polyline[
         :points((@points, map {(@t »+=» $_).clone}, ($scale,0), (0,$scale), (-$scale,0)).join: ','),
         :fill<black>, :transform("rotate(45, 300, 300)"), :style<stroke:#61D4FF>,
       ],
       :polyline[
         :points(@points.map( -> $x,$y { $x, $dim - $y + 1 }).join: ','),
         :fill<black>, :transform("rotate(45, 300, 300)"), :style<stroke:#61D4FF>,
       ],
   ],
);</lang> See: Sierpinski-square-curve-perl6.svg (offsite SVG image)
Rust
Program output is a file in SVG format. <lang rust>// [dependencies] // svg = "0.8.0"
use svg::node::element::path::Data; use svg::node::element::Path;
struct SierpinskiSquareCurve {
   current_x: f64,
   current_y: f64,
   current_angle: i32,
   line_length: f64,
}
impl SierpinskiSquareCurve {
   fn new(x: f64, y: f64, length: f64, angle: i32) -> SierpinskiSquareCurve {
       SierpinskiSquareCurve {
           current_x: x,
           current_y: y,
           current_angle: angle,
           line_length: length,
       }
   }
   fn rewrite(order: usize) -> String {
       let mut str = String::from("F+XF+F+XF");
       for _ in 0..order {
           let mut tmp = String::new();
           for ch in str.chars() {
               match ch {
                   'X' => tmp.push_str("XF-F+F-XF+F+XF-F+F-X"),
                   _ => tmp.push(ch),
               }
           }
           str = tmp;
       }
       str
   }
   fn execute(&mut self, order: usize) -> Path {
       let mut data = Data::new().move_to((self.current_x, self.current_y));
       for ch in SierpinskiSquareCurve::rewrite(order).chars() {
           match ch {
               'F' => data = self.draw_line(data),
               '+' => self.turn(90),
               '-' => self.turn(-90),
               _ => {}
           }
       }
       Path::new()
           .set("fill", "none")
           .set("stroke", "black")
           .set("stroke-width", "1")
           .set("d", data)
   }
   fn draw_line(&mut self, data: Data) -> Data {
       let theta = (self.current_angle as f64).to_radians();
       self.current_x += self.line_length * theta.cos();
       self.current_y += self.line_length * theta.sin();
       data.line_to((self.current_x, self.current_y))
   }
   fn turn(&mut self, angle: i32) {
       self.current_angle = (self.current_angle + angle) % 360;
   }
   fn save(file: &str, size: usize, length: f64, order: usize) -> std::io::Result<()> {
       use svg::node::element::Rectangle;
       let x = (size as f64 - length) / 2.0;
       let y = length;
       let rect = Rectangle::new()
           .set("width", "100%")
           .set("height", "100%")
           .set("fill", "white");
       let mut s = SierpinskiSquareCurve::new(x, y, length, 0);
       let document = svg::Document::new()
           .set("width", size)
           .set("height", size)
           .add(rect)
           .add(s.execute(order));
       svg::save(file, &document)
   }
}
fn main() {
SierpinskiSquareCurve::save("sierpinski_square_curve.svg", 635, 5.0, 5).unwrap();
}</lang>
- Output:
See: sierpinski_square_curve.svg (offsite SVG image)
Sidef
Uses the LSystem() class from Hilbert curve. <lang ruby>var rules = Hash(
x => 'xF-F+F-xF+F+xF-F+F-x',
)
var lsys = LSystem(
   width:  510,
   height: 510,
   xoff: -505,
   yoff: -254,
   len:   4,
   angle: 90,
   color: 'dark green',
)
lsys.execute('F+xF+F+xF', 5, "sierpiński_square_curve.png", rules)</lang> Output image: Sierpiński square curve
VBScript
Output to html (svg) displayed in the default browser. A turtle graphics class helps to keep the curve definition simple <lang vb>
option explicit 'outputs turtle graphics to svg file and opens it
const pi180= 0.01745329251994329576923690768489 ' pi/180 const pi=3.1415926535897932384626433832795 'pi class turtle
  dim fso
  dim fn
  dim svg

  dim iang  'radians
  dim ori   'radians
  dim incr
  dim pdown
  dim clr
  dim x
  dim y
  public property let orient(n):ori = n*pi180 :end property
  public property let iangle(n):iang= n*pi180 :end property
  public sub pd() : pdown=true: end sub
  public sub pu()  :pdown=FALSE :end sub

  public sub rt(i)
    ori=ori - i*iang:
    'if ori<0 then ori = ori+pi*2
  end sub
  public sub lt(i):
    ori=(ori + i*iang)
    'if ori>(pi*2) then ori=ori-pi*2
  end sub

  public sub bw(l)
     x= x+ cos(ori+pi)*l*incr
     y= y+ sin(ori+pi)*l*incr
    ' ori=ori+pi '?????
  end sub

  public sub fw(l)
     dim x1,y1
     x1=x + cos(ori)*l*incr
     y1=y + sin(ori)*l*incr
     if pdown then line x,y,x1,y1
     x=x1:y=y1
  end sub

  Private Sub Class_Initialize()
     setlocale "us"
     initsvg
     x=400:y=400:incr=100
     ori=90*pi180
     iang=90*pi180
     clr=0
     pdown=true
  end sub

  Private Sub Class_Terminate()
     disply
  end sub

  private sub line (x,y,x1,y1)
     svg.WriteLine "<line x1=""" & x & """ y1= """& y & """ x2=""" & x1& """ y2=""" & y1 & """/>"
  end sub
  private sub disply()
      dim shell
      svg.WriteLine "</svg></body></html>"
      svg.close
      Set shell = CreateObject("Shell.Application")
      shell.ShellExecute fn,1,False
  end sub
  private sub initsvg()
    dim scriptpath
    Set fso = CreateObject ("Scripting.Filesystemobject")
    ScriptPath= Left(WScript.ScriptFullName, InStrRev(WScript.ScriptFullName, "\"))
    fn=Scriptpath & "SIERP.HTML"
    Set svg = fso.CreateTextFile(fn,True)
    if SVG IS nothing then wscript.echo "Can't create svg file" :vscript.quit
    svg.WriteLine "<!DOCTYPE html>" &vbcrlf & "<html>" &vbcrlf & "<head>"
    svg.writeline "<style>" & vbcrlf & "line {stroke:rgb(255,0,0);stroke-width:.5}" &vbcrlf &"</style>"
    svg.writeline "</head>"&vbcrlf & "<body>"
    svg.WriteLine "<svg xmlns=""http://www.w3.org/2000/svg"" width=""800"" height=""800"" viewBox=""0 0 800 800"">"
  end sub
end class
'to half.sierpinski :size :level ' if :level = 0 [forward :size stop] ' half.sierpinski :size :level - 1 ' left 45 ' forward :size * sqrt 2 ' left 45 ' half.sierpinski :size :level - 1 ' right 90 ' forward :size ' right 90 ' half.sierpinski :size :level - 1 ' left 45 ' forward :size * sqrt 2 ' left 45 ' half.sierpinski :size :level - 1 'end const raiz2=1.4142135623730950488016887242097 sub media_sierp (niv,sz)
  if niv=0 then x.fw sz: exit sub
  media_sierp niv-1,sz
  x.lt 1
  x.fw sz*raiz2
  x.lt 1
   media_sierp niv-1,sz
  x.rt 2
  x.fw sz
  x.rt 2
 media_sierp niv-1,sz
  x.lt 1
  x.fw sz*raiz2
  x.lt 1
   media_sierp niv-1,sz
end sub
'to sierpinski :size :level ' half.sierpinski :size :level ' right 90 ' forward :size ' right 90 ' half.sierpinski :size :level ' right 90 ' forward :size ' right 90 'end
sub sierp(niv,sz)
  media_sierp niv,sz
  x.rt 2
  x.fw sz
  x.rt 2
  media_sierp niv,sz
  x.rt 2
  x.fw sz
  x.rt 2
end sub
dim x set x=new turtle x.iangle=45 x.orient=0 x.incr=1 x.x=100:x.y=270 'star5 sierp 5,4 set x=nothing </lang>
Wren
<lang ecmascript>import "graphics" for Canvas, Color import "dome" for Window import "math" for Math import "./lsystem" for LSystem, Rule
var TwoPi = Num.pi * 2
class SierpinskiSquareCurve {
   construct new(width, height, back, fore) {
       Window.title = "Sierpinski Square Curve"
       Window.resize(width, height)
       Canvas.resize(width, height)
       _w = width
       _h = height
       _bc = back
       _fc = fore
   }
   init() {
       Canvas.cls(_bc)
       var cx = 10
       var cy = (_h/2).floor + 5
       var theta = 0
       var h = 6
       var lsys = LSystem.new(
           ["X"],                                    //  variables
           ["F", "+", "-"],                          //  constants
           "F+XF+F+XF",                              //  axiom
           [Rule.new("X", "XF-F+F-XF+F+XF-F+F-X")],  //  rules
           Num.pi / 2                                //  angle (90 degrees in radians)
       )
       var result = lsys.iterate(5)
       var operations = {
           "F": Fn.new {
               var newX = cx + h*Math.sin(theta)
               var newY = cy - h*Math.cos(theta)
               Canvas.line(cx, cy, newX, newY, _fc, 2)
               cx = newX
               cy = newY
           },
           "+": Fn.new {
               theta = (theta + lsys.angle) % TwoPi
           },
           "-": Fn.new {
               theta = (theta - lsys.angle) % TwoPi
           }
       }
       LSystem.execute(result, operations)
   }
update() {}
draw(alpha) {}
}
var Game = SierpinskiSquareCurve.new(770, 770, Color.blue, Color.yellow)</lang>
zkl
Uses Image Magick and the PPM class from http://rosettacode.org/wiki/Bitmap/Bresenham%27s_line_algorithm#zkl <lang zkl>sierpinskiSquareCurve(4) : turtle(_);
fcn sierpinskiSquareCurve(n){ // Lindenmayer system --> Data of As
  var [const] A="AF-F+F-AF+F+AF-F+F-A", B="";  // Production rules
  var [const] Axiom="F+AF+F+AF";
  buf1,buf2 := Data(Void,Axiom).howza(3), Data().howza(3);  // characters
  do(n){
     buf1.pump(buf2.clear(),fcn(c){ if(c=="A") A else if(c=="B") B else c });
     t:=buf1; buf1=buf2; buf2=t;	// swap buffers
  }
  buf1		// n=4 --> 3,239 characters
}
fcn turtle(curve){ // a "square" turtle, directions are +-90*
  const D=10;
  ds,dir := T( T(D,0), T(0,-D), T(-D,0), T(0,D) ), 2; // turtle offsets
  dx,dy := ds[dir];
  img,color := PPM(650,650), 0x00ff00;  // green on black
  x,y := img.w/2, 10;
  curve.replace("A","").replace("B","");  // A & B are no-op during drawing
  foreach c in (curve){
     switch(c){
case("F"){ img.line(x,y, (x+=dx),(y+=dy), color) } // draw forward case("+"){ dir=(dir+1)%4; dx,dy = ds[dir] } // turn right 90* case("-"){ dir=(dir-1)%4; dx,dy = ds[dir] } // turn left 90*
     }
  }
  img.writeJPGFile("sierpinskiSquareCurve.zkl.jpg");
}</lang>
- Output:
Offsite image at Sierpinski square curve of order 4