
Superellipse

You are encouraged to solve this task according to the task description, using any language you may know.
A superellipse is a geometric figure defined as the set of all points (x, y) with

where n, a, and b are positive numbers.
- Task
Draw a superellipse with n = 2.5, and a = b = 200
C
Interactive program to draw a SuperEllipse. Requires the WinBGIm library. <lang C>
- include<graphics.h>
- include<stdio.h>
- include<math.h>
- define pi M_PI
int main(){
double a,b,n,i,incr = 0.0001;
printf("Enter major and minor axes of the SuperEllipse : "); scanf("%lf%lf",&a,&b);
printf("Enter n : "); scanf("%lf",&n);
initwindow(500,500,"Superellipse");
for(i=0;i<2*pi;i+=incr){ putpixel(250 + a*pow(fabs(cos(i)),2/n)*(pi/2<i && i<3*pi/2?-1:1),250 + b*pow(fabs(sin(i)),2/n)*(pi<i && i<2*pi?-1:1),15); }
printf("Done. %lf",i);
getch();
closegraph(); }</lang>
EchoLisp
Link to the super-ellipse image. <lang scheme> (lib 'plot) (define (eaxpt x n) (expt (abs x) n)) (define (Ellie x y) (+ (eaxpt (// x 200) 2.5) (eaxpt (// y 200) 2.5) -1))
(plot-xy Ellie -400 -400)
→ (("x:auto" -400 400) ("y:auto" -400 400))
</lang>
FreeBASIC
<lang freebasic>' version 23-10-2016 ' compile with: fbc -s console
Const scr_x = 800 ' screen 800 x 800 Const scr_y = 600 Const m_x = scr_x \ 2 ' middle of screen Const m_y = scr_y \ 2
Sub superellipse(a As Long, b As Long, n As Double)
   ReDim As Long y(0 To a)
   Dim As Long x
   y(0) = b ' value for x = 0
   y(a) = 0 ' value for x = a
'(0,0) is in upper left corner
PSet (m_x, m_y - y(0)) ' set starting point
   For x = 1 To a-1
       y(x) = Int( Exp( Log(1 - ((x / a) ^ n)) / n ) * b )
       Line - ((m_x + x), (m_y - y(x)))
   Next
   For x = a To 0 Step -1
       Line - ((m_x + x), (m_y + y(x)))
   Next
   For x = 0 To a
       Line - ((m_x - x), (m_y + y(x)))
   Next
   For x = a To 0 Step -1
       Line - ((m_x - x), (m_y - y(x)))
   Next
End Sub
' ------=< MAIN >=------
ScreenRes scr_x, scr_y, 32
Dim As Long a = 200 Dim As Long b = 150 Dim As Double n = 2.5
superellipse(a, b, n)
' empty keyboard buffer While Inkey <> "" : Wend Print : Print "hit any key to end program" Sleep End</lang>
Go
<lang go>package main
import (
   "github.com/fogleman/gg"
   "math"
)
/* assumes a and b are always equal */ func superEllipse(dc *gg.Context, n float64, a int) {
   hw := float64(dc.Width() / 2)
   hh := float64(dc.Height() / 2)
   // calculate y for each x
   y := make([]float64, a+1)
   for x := 0; x <= a; x++ {
       aa := math.Pow(float64(a), n)
       xx := math.Pow(float64(x), n)
       y[x] = math.Pow(aa-xx, 1.0/n)
   }
   // draw quadrants
   for x := a; x >= 0; x-- {
       dc.LineTo(hw+float64(x), hh-y[x])
   }
   for x := 0; x <= a; x++ {
       dc.LineTo(hw+float64(x), hh+y[x])
   }
   for x := a; x >= 0; x-- {
       dc.LineTo(hw-float64(x), hh+y[x])
   }
   for x := 0; x <= a; x++ {
       dc.LineTo(hw-float64(x), hh-y[x])
   }
   dc.SetRGB(1, 1, 1) // white ellipse
   dc.Fill()
}
func main() {
   dc := gg.NewContext(500, 500)
   dc.SetRGB(0, 0, 0) // black background
   dc.Clear()
   superEllipse(dc, 2.5, 200)
   dc.SavePNG("superellipse.png")
}</lang>
- Output:
Image similar to J entry.
Haskell
Use the ghcjs compiler to compile to JavaScript that runs in a browser. The reflex-dom library is used to help with SVG rendering and input. <lang haskell>{-# LANGUAGE OverloadedStrings, RankNTypes #-} import Reflex import Reflex.Dom import Data.Text (Text, pack, unpack) import Data.Map (Map, fromList, empty) import Text.Read (readMaybe)
width = 600 height = 500
type Point = (Float,Float) type Segment = (Point,Point)
data Ellipse = Ellipse {a :: Float, b :: Float, n :: Float}
toFloat :: Text -> Maybe Float toFloat = readMaybe.unpack
toEllipse :: Maybe Float -> Maybe Float -> Maybe Float -> Maybe Ellipse toEllipse (Just a) (Just b) (Just n) =
   if a < 1.0 || b <= 1.0 || n <= 0.0  -- not all floats are valid
   then Nothing
   else Just $ Ellipse a b n
toEllipse _ _ _ = Nothing
showError :: Maybe a -> String showError Nothing = "invalid input" showError _ = ""
reflect45 pts = pts ++ fmap (\(x,y) -> ( y, x)) (reverse pts) rotate90 pts = pts ++ fmap (\(x,y) -> ( y, -x)) pts rotate180 pts = pts ++ fmap (\(x,y) -> (-x, -y)) pts scale a b = fmap (\(x,y) -> ( a*x, b*y )) segments pts = zip pts $ tail pts
toLineMap :: Maybe Ellipse -> Map Int ((Float,Float),(Float,Float)) toLineMap (Just (Ellipse a b n)) =
   let f p = (1 - p**n)**(1/n)
       dp = iterate (*0.9) 1.0
       ip = map (\p -> 1.0 -p) dp
       points s =
           if n > 1.0
           then (\p -> zip p (map f p)) ip
           else (\p -> zip (map f p) p) dp
   in fromList $  -- changes list to map (for listWithKey)
      zip [0..] $ -- annotates segments with index
      segments $  -- changes points to line segments
      scale a b $
      rotate180 $ -- doubles the point count
      rotate90 $  -- doubles the point count
      reflect45 $ -- doubles the point count
      takeWhile (\(x,y) -> x < y ) $ -- stop at 45 degree line
      points 0.9
toLineMap Nothing = empty
lineAttrs :: Segment -> Map Text Text lineAttrs ((x1,y1), (x2,y2)) =
   fromList [ ( "x1",    pack $ show (width/2+x1))
            , ( "y1",    pack $ show (height/2+y1))
            , ( "x2",    pack $ show (width/2+x2))
            , ( "y2",    pack $ show (height/2+y2))
            , ( "style", "stroke:brown;stroke-width:2")
            ]
showLine :: MonadWidget t m => Int -> Dynamic t Segment -> m () showLine _ dSegment = do
   elSvgns "line" (lineAttrs <$> dSegment) $ return ()
   return ()
main = mainWidget $ do
   elAttr "h1" ("style" =: "color:brown") $ text "Superellipse"
   ta <- el "div" $ do
       text "a: "
       textInput def { _textInputConfig_initialValue = "200"}
   tb <- el "div" $ do
       text "b: "
       textInput def { _textInputConfig_initialValue = "200"}
   tn <- el "div" $ do
       text "n: "
       textInput def { _textInputConfig_initialValue = "2.5"}
   let
       ab = zipDynWith toEllipse (toFloat <$> value ta) (toFloat <$> value tb)
       dEllipse = zipDynWith ($) ab (toFloat <$> value tn)
       dLines = fmap toLineMap dEllipse

       dAttrs = constDyn $ fromList
                    [ ("width" , pack $ show width)
                    , ("height", pack $ show height)
                    ]
   elAttr "div" ("style" =: "color:red") $ dynText $ fmap (pack.showError) dEllipse
   el "div" $ elSvgns "svg" dAttrs $ listWithKey dLines showLine
   return ()
-- At end to avoid Rosetta Code unmatched quotes problem. elSvgns :: forall t m a. MonadWidget t m => Text -> Dynamic t (Map Text Text) -> m a -> m (El t, a) elSvgns = elDynAttrNS' (Just "http://www.w3.org/2000/svg")</lang>
Link to live demo: https://dc25.github.io/superEllipseReflex/
J

We will fill the ellipse so that we do not have to worry about the size and shape of our pixels:
<lang J>selips=: 4 :0
 'n a b'=. y
 1 >: ((n^~a%~]) +&|/ n^~b%~]) i:x
)
  require'viewmat'
  viewmat 300 selips 2.5 200 200</lang>
Java

<lang java>import java.awt.*; import java.awt.geom.Path2D; import static java.lang.Math.pow; import java.util.Hashtable; import javax.swing.*; import javax.swing.event.*;
public class SuperEllipse extends JPanel implements ChangeListener {
private double exp = 2.5;
   public SuperEllipse() {
       setPreferredSize(new Dimension(650, 650));
       setBackground(Color.white);
       setFont(new Font("Serif", Font.PLAIN, 18));
   }
   void drawGrid(Graphics2D g) {
       g.setStroke(new BasicStroke(2));
       g.setColor(new Color(0xEEEEEE));
       int w = getWidth();
       int h = getHeight();
       int spacing = 25;
       for (int i = 0; i < w / spacing; i++) {
           g.drawLine(0, i * spacing, w, i * spacing);
           g.drawLine(i * spacing, 0, i * spacing, w);
       }
       g.drawLine(0, h - 1, w, h - 1);
       g.setColor(new Color(0xAAAAAA));
       g.drawLine(0, w / 2, w, w / 2);
       g.drawLine(w / 2, 0, w / 2, w);
   }
   void drawLegend(Graphics2D g) {
       g.setColor(Color.black);
       g.setFont(getFont());
       g.drawString("n = " + String.valueOf(exp), getWidth() - 150, 45);
       g.drawString("a = b = 200", getWidth() - 150, 75);
   }
void drawEllipse(Graphics2D g) {
       final int a = 200; // a = b
       double[] points = new double[a + 1];
       Path2D p = new Path2D.Double();
       p.moveTo(a, 0);
       // calculate first quadrant
       for (int x = a; x >= 0; x--) {
           points[x] = pow(pow(a, exp) - pow(x, exp), 1 / exp); // solve for y
           p.lineTo(x, -points[x]);
       }
       // mirror to others
       for (int x = 0; x <= a; x++)
           p.lineTo(x, points[x]);
       for (int x = a; x >= 0; x--)
           p.lineTo(-x, points[x]);
       for (int x = 0; x <= a; x++)
           p.lineTo(-x, -points[x]);
       g.translate(getWidth() / 2, getHeight() / 2);
       g.setStroke(new BasicStroke(2));
       g.setColor(new Color(0x25B0C4DE, true));
       g.fill(p);
       g.setColor(new Color(0xB0C4DE)); // LightSteelBlue
       g.draw(p);
   }
   @Override
   public void paintComponent(Graphics gg) {
       super.paintComponent(gg);
       Graphics2D g = (Graphics2D) gg;
       g.setRenderingHint(RenderingHints.KEY_ANTIALIASING,
               RenderingHints.VALUE_ANTIALIAS_ON);
       g.setRenderingHint(RenderingHints.KEY_TEXT_ANTIALIASING,
               RenderingHints.VALUE_TEXT_ANTIALIAS_ON);
       drawGrid(g);
       drawLegend(g);
       drawEllipse(g);
   }
   @Override
   public void stateChanged(ChangeEvent e) {
       JSlider source = (JSlider) e.getSource();
       exp = source.getValue() / 2.0;
       repaint();
   }
   public static void main(String[] args) {
       SwingUtilities.invokeLater(() -> {
           JFrame f = new JFrame();
           f.setDefaultCloseOperation(JFrame.EXIT_ON_CLOSE);
           f.setTitle("Super Ellipse");
           f.setResizable(false);
           SuperEllipse panel = new SuperEllipse();
           f.add(panel, BorderLayout.CENTER);
           JSlider exponent = new JSlider(JSlider.HORIZONTAL, 1, 9, 5);
           exponent.addChangeListener(panel);
           exponent.setMajorTickSpacing(1);
           exponent.setPaintLabels(true);
           exponent.setBackground(Color.white);
           exponent.setBorder(BorderFactory.createEmptyBorder(20, 20, 20, 20));
           Hashtable<Integer, JLabel> labelTable = new Hashtable<>();
           for (int i = 1; i < 10; i++)
               labelTable.put(i, new JLabel(String.valueOf(i * 0.5)));
           exponent.setLabelTable(labelTable);
f.add(exponent, BorderLayout.SOUTH);
           f.pack();
           f.setLocationRelativeTo(null);
           f.setVisible(true);
       });
   }
}</lang>
JavaScript
<lang javascript> var n = 2.5, a = 200, b = 200, ctx;
function point( x, y ) {
ctx.fillRect( x, y, 1, 1);
}
function start() {
   var can = document.createElement('canvas');
   can.width  = can.height = 600;
   ctx = can.getContext( "2d" );
   ctx.rect( 0, 0, can.width, can.height );
   ctx.fillStyle = "#000000"; ctx.fill();
   document.body.appendChild( can );
   ctx.fillStyle = "#ffffff";
   for( var t = 0; t < 1000; t += .1 ) {
      x = Math.pow( Math.abs( Math.cos( t ) ), 2 / n ) * a * Math.sign( Math.cos( t ) );
      y = Math.pow( Math.abs( Math.sin( t ) ), 2 / n ) * b * Math.sign( Math.sin( t ) );
      point( x + ( can.width >> 1 ), y + ( can.height >> 1 ) );
   }
} </lang>
Julia
<lang julia>function superellipse(n, a, b, step::Int=100)
   @assert n > 0 && a > 0 && b > 0
   na = 2 / n
   pc = 2π / step
   t  = 0
   xp = Vector{Float64}(step + 1)
   yp = Vector{Float64}(step + 1)
   for i in 0:step
       # because sin^n(x) is mathematically the same as (sin(x))^n...
       xp[i+1] = abs((cos(t))) ^ na * a * sign(cos(t))
       yp[i+1] = abs((sin(t))) ^ na * b * sign(sin(t))
       t += pc
   end
   return xp, yp
end
using UnicodePlots
x, y = superellipse(2.5, 200, 200) println(lineplot(x, y))</lang>
- Output:
        ┌────────────────────────────────────────┐
    200 │⠀⠀⠀⠀⠀⠀⠀⢀⣠⠤⠔⠒⠊⠉⠉⠉⠉⠉⠉⠉⡏⠉⠉⠉⠉⠉⠉⠒⠒⠢⠤⣀⡀⠀⠀⠀⠀⠀⠀⠀│
        │⠀⠀⠀⠀⣀⠤⠊⠁⠀⠀⠀⠀⠀⠀⠀⠀⠀⠀⠀⠀⡇⠀⠀⠀⠀⠀⠀⠀⠀⠀⠀⠀⠈⠓⠤⣀⠀⠀⠀⠀│
        │⠀⠀⢀⠜⠀⠀⠀⠀⠀⠀⠀⠀⠀⠀⠀⠀⠀⠀⠀⠀⡇⠀⠀⠀⠀⠀⠀⠀⠀⠀⠀⠀⠀⠀⠀⠈⠢⡄⠀⠀│
        │⠀⡠⠃⠀⠀⠀⠀⠀⠀⠀⠀⠀⠀⠀⠀⠀⠀⠀⠀⠀⡇⠀⠀⠀⠀⠀⠀⠀⠀⠀⠀⠀⠀⠀⠀⠀⠀⠘⢆⠀│
        │⢰⠁⠀⠀⠀⠀⠀⠀⠀⠀⠀⠀⠀⠀⠀⠀⠀⠀⠀⠀⡇⠀⠀⠀⠀⠀⠀⠀⠀⠀⠀⠀⠀⠀⠀⠀⠀⠀⠈⡆│
        │⡎⠀⠀⠀⠀⠀⠀⠀⠀⠀⠀⠀⠀⠀⠀⠀⠀⠀⠀⠀⡇⠀⠀⠀⠀⠀⠀⠀⠀⠀⠀⠀⠀⠀⠀⠀⠀⠀⠀⢱│
        │⡇⠀⠀⠀⠀⠀⠀⠀⠀⠀⠀⠀⠀⠀⠀⠀⠀⠀⠀⠀⡇⠀⠀⠀⠀⠀⠀⠀⠀⠀⠀⠀⠀⠀⠀⠀⠀⠀⠀⢸│
        │⡧⠤⠤⠤⠤⠤⠤⠤⠤⠤⠤⠤⠤⠤⠤⠤⠤⠤⠤⠤⡧⠤⠤⠤⠤⠤⠤⠤⠤⠤⠤⠤⠤⠤⠤⠤⠤⠤⠤⢼│
        │⡇⠀⠀⠀⠀⠀⠀⠀⠀⠀⠀⠀⠀⠀⠀⠀⠀⠀⠀⠀⡇⠀⠀⠀⠀⠀⠀⠀⠀⠀⠀⠀⠀⠀⠀⠀⠀⠀⠀⢸│
        │⢇⠀⠀⠀⠀⠀⠀⠀⠀⠀⠀⠀⠀⠀⠀⠀⠀⠀⠀⠀⡇⠀⠀⠀⠀⠀⠀⠀⠀⠀⠀⠀⠀⠀⠀⠀⠀⠀⠀⡸│
        │⠸⡀⠀⠀⠀⠀⠀⠀⠀⠀⠀⠀⠀⠀⠀⠀⠀⠀⠀⠀⡇⠀⠀⠀⠀⠀⠀⠀⠀⠀⠀⠀⠀⠀⠀⠀⠀⠀⢀⠇│
        │⠀⠱⡄⠀⠀⠀⠀⠀⠀⠀⠀⠀⠀⠀⠀⠀⠀⠀⠀⠀⡇⠀⠀⠀⠀⠀⠀⠀⠀⠀⠀⠀⠀⠀⠀⠀⠀⢠⠊⠀│
        │⠀⠀⠘⠢⡀⠀⠀⠀⠀⠀⠀⠀⠀⠀⠀⠀⠀⠀⠀⠀⡇⠀⠀⠀⠀⠀⠀⠀⠀⠀⠀⠀⠀⠀⠀⠀⡔⠁⠀⠀│
        │⠀⠀⠀⠀⠉⠒⢤⡀⠀⠀⠀⠀⠀⠀⠀⠀⠀⠀⠀⠀⡇⠀⠀⠀⠀⠀⠀⠀⠀⠀⠀⠀⢀⡠⠒⠉⠀⠀⠀⠀│
   -200 │⠀⠀⠀⠀⠀⠀⠀⠈⠉⠒⠢⠤⠤⣀⣀⣀⣀⣀⣀⣀⣇⣀⣀⣀⣀⣀⣀⡠⠤⠔⠒⠋⠁⠀⠀⠀⠀⠀⠀⠀│
        └────────────────────────────────────────┘
        -200                                   200
Kotlin
The following is based on the Java entry but dispenses with the grid and slider as these aren't really part of the task. <lang scala>// version 1.1.2
import java.awt.* import java.awt.geom.Path2D import javax.swing.* import java.lang.Math.pow
/* assumes a == b */ class SuperEllipse(val n: Double, val a: Int) : JPanel() {
   init {
       require(n > 0.0 && a > 0)
       preferredSize = Dimension(650, 650)
       background = Color.black
   }
   private fun drawEllipse(g: Graphics2D) {
       val points = DoubleArray(a + 1)
       val p = Path2D.Double()
       p.moveTo(a.toDouble(), 0.0)
       // calculate first quadrant
       for (x in a downTo 0) {
           points[x] = pow(pow(a.toDouble(), n) - pow(x.toDouble(), n), 1.0 / n)
           p.lineTo(x.toDouble(), -points[x])
       }

       // mirror to others
       for (x in 0..a) p.lineTo(x.toDouble(), points[x])
       for (x in a downTo 0) p.lineTo(-x.toDouble(), points[x])
       for (x in 0..a) p.lineTo(-x.toDouble(), -points[x])
       with(g) {
           translate(width / 2, height / 2)
           color = Color.yellow
           fill(p)
       }
   }
   override fun paintComponent(gg: Graphics) {
       super.paintComponent(gg)
       val g = gg as Graphics2D
       g.setRenderingHint(RenderingHints.KEY_ANTIALIASING,
                          RenderingHints.VALUE_ANTIALIAS_ON)
       g.setRenderingHint(RenderingHints.KEY_TEXT_ANTIALIASING,
                          RenderingHints.VALUE_TEXT_ANTIALIAS_ON)
       drawEllipse(g)
   }
}
fun main(args: Array<String>) {
   SwingUtilities.invokeLater {
       val f = JFrame()
       with (f) {
           defaultCloseOperation = JFrame.EXIT_ON_CLOSE
           title = "Super Ellipse"
           isResizable = false
           add(SuperEllipse(2.5, 200), BorderLayout.CENTER)
           pack()
           setLocationRelativeTo(null)
           isVisible = true
       }
   }
}</lang>
Maple
The built-in command ImplicitPlot accepts an equation in 2 variables: <lang maple>plots:-implicitplot(abs((1/200)*x^2.5)+abs((1/200)*y^2.5) = 1, x = -10 .. 10, y = -10 .. 10);</lang>
Mathematica
The built-in function ContourPlot accepts and equation in 2 variables and creates the desired plot <lang Mathematica>ContourPlot[
Abs[x/200]^2.5 + Abs[y/200]^2.5 == 1, {x, -200, 200}, {y, -200, 200}]</lang>
ooRexx
This program draws 5 super ellipses:
black 120,120,1.5
blue  160,160,2
red   200,200,2.5
green 240,240,3
black 280,280,4
<lang oorexx>/* REXX ***************************************************************
- Create a BMP file showing a few super ellipses
- /
Parse Version v If pos('Regina',v)>0 Then
superegg='superegga.bmp'
Else
superegg='supereggx.bmp'
'erase' superegg s='424d4600000000000000360000002800000038000000280000000100180000000000'X||,
'1000000000000000000000000000000000000000'x
z.0=0 black='000000'x white='ffffff'x red ='00ff00'x green='ff0000'x blue ='0000ff'x m=80 n=80 hor=m*8 /* 56 */ ver=n*8 /* 40 */ s=overlay(lend(hor),s,19,4) s=overlay(lend(ver),s,23,4) z.=copies('f747ff'x,3192%3) z.=copies('ffffff'x,8*m) z.0=648 u=320 v=320 Call supegg black,120,120,1.5,u,v Call supegg blue,160,160,2,u,v Call supegg red,200,200,2.5,u,v Call supegg green,240,240,3,u,v Call supegg black,280,280,4,u,v
Do i=1 To z.0
 s=s||z.i
 End
Call lineout superegg,s Call lineout superegg Exit
supegg: Parse Arg color,a,b,n,u,v Do y=0 To b
 t=(1-rxCalcpower(y/b,n))
 x=a*rxCalcpower(t,1/n)
 Call point color,format(u+x,4,0),format(v+y,4,0)
 Call point color,format(u-x,4,0),format(v+y,4,0)
 Call point color,format(u+x,4,0),format(v-y,4,0)
 Call point color,format(u-x,4,0),format(v-y,4,0)
 End
Do x=0 To a
 t=(1-rxCalcpower(x/b,n))
 y=a*rxCalcpower(t,1/n)
 Call point color,format(u+x,4,0),format(v+y,4,0)
 Call point color,format(u-x,4,0),format(v+y,4,0)
 Call point color,format(u+x,4,0),format(v-y,4,0)
 Call point color,format(u-x,4,0),format(v-y,4,0)
 End
Return
lend: Return reverse(d2c(arg(1),4))
point: Procedure Expose z.
 Call trace 'O'
 Parse Arg color,x0,y0
 --Say x0 y0
 Do x=x0-2 To x0+2
   Do y=y0-2 To y0+2
     z.y=overlay(copies(color,3),z.y,3*x)
     End
   End
 Return
- requires rxMath library</lang>
Perl 6
Generate an svg image to STDOUT. Redirect into a file to capture it. <lang perl6>constant a = 200; constant b = 200; constant n = 2.5;
- y in terms of x
sub y ($x) { sprintf "%d", b * (1 - ($x / a).abs ** n ) ** (1/n) }
- find point pairs for one quadrant
my @q = flat map -> \x { x, y(x) }, (0, 2 ... 200);
- Generate an SVG image
INIT say qq:to/STOP/;
   <?xml version="1.0" standalone="no"?>
   <!DOCTYPE svg PUBLIC "-//W3C//DTD SVG 1.1//EN" "http://www.w3.org/Graphics/SVG/1.1/DTD/svg11.dtd">
   <svg height="{b*2}" width="{a*2}" version="1.1" xmlns="http://www.w3.org/2000/svg">
   STOP
END say '</svg>';
.put for pline( @q ), pline( @q «*» ( 1,-1) ), # flip and mirror pline( @q «*» (-1,-1) ), # for the other pline( @q «*» (-1, 1) ); # three quadrants
sub pline (@q) {
   qq:to/END/;
   <polyline points="{@q}"
   style="fill:none; stroke:black; stroke-width:3" transform="translate({a}, {b})" />
   END
}</lang> See Superellipse image
Python
<lang python>
- Superellipse drawing in Python 2.7.9
- pic can see at http://www.imgup.cz/image/712
import matplotlib.pyplot as plt from math import sin, cos, pi
def sgn(x): return ((x>0)-(x<0))*1
a,b,n=200,200,2.5 # param n making shape na=2/n step=100 # accuracy piece=(pi*2)/step xp=[];yp=[]
t=0 for t1 in range(step+1): # because sin^n(x) is mathematically the same as (sin(x))^n... x=(abs((cos(t)))**na)*a*sgn(cos(t)) y=(abs((sin(t)))**na)*b*sgn(sin(t)) xp.append(x);yp.append(y) t+=piece
plt.plot(xp,yp) # plotting all point from array xp, yp plt.title("Superellipse with parameter "+str(n)) plt.show() </lang>
Racket
<lang Racket>#lang racket (require plot)
- (plot-new-window? #t)
(define ((superellipse a b n) x y)
 (+ (expt (abs (/ x a)) n)
    (expt (abs (/ y b)) n)))
(plot (isoline (superellipse 200 200 2.5) 1
-220 220 -220 220))</lang>
REXX
Here you can see a picture: http://austria-forum.org/af/User/Pachl%20Walter
<lang rexx>/* REXX ***************************************************************
- Create a BMP file showing a few super ellipses
- /
Parse Version v If pos('Regina',v)>0 Then
superegg='superegga.bmp'
Else
superegg='supereggo.bmp'
'erase' superegg s='424d4600000000000000360000002800000038000000280000000100180000000000'X||,
'1000000000000000000000000000000000000000'x
z.0=0 black='000000'x white='ffffff'x red ='00ff00'x green='ff0000'x blue ='0000ff'x m=80 n=80 hor=m*8 /* 56 */ ver=n*8 /* 40 */ s=overlay(lend(hor),s,19,4) s=overlay(lend(ver),s,23,4) z.=copies('f747ff'x,3192%3) z.=copies('ffffff'x,8*m) z.0=648 u=320 v=320 Call supegg black,080,080,0.5,u,v Call supegg black,110,110,1 ,u,v Call supegg black,140,140,1.5,u,v Call supegg blue ,170,170,2 ,u,v Call supegg red ,200,200,2.5,u,v Call supegg green,230,230,3 ,u,v Call supegg black,260,260,4 ,u,v Call supegg black,290,290,7 ,u,v Do i=1 To z.0
 s=s||z.i
 End
Call lineout superegg,s Call lineout superegg Exit
supegg: Parse Arg color,a,b,n,u,v Do y=0 To b
 t=(1-power(y/b,n))
 x=a*power(t,1/n)
 Call point color,format(u+x,4,0),format(v+y,4,0)
 Call point color,format(u-x,4,0),format(v+y,4,0)
 Call point color,format(u+x,4,0),format(v-y,4,0)
 Call point color,format(u-x,4,0),format(v-y,4,0)
 End
Do x=0 To a
 t=(1-power(x/b,n))
 y=a*power(t,1/n)
 Call point color,format(u+x,4,0),format(v+y,4,0)
 Call point color,format(u-x,4,0),format(v+y,4,0)
 Call point color,format(u+x,4,0),format(v-y,4,0)
 Call point color,format(u-x,4,0),format(v-y,4,0)
 End
Return
lend: Return reverse(d2c(arg(1),4))
point: Procedure Expose z.
 Call trace 'O'
 Parse Arg color,x0,y0
 --Say x0 y0
 Do x=x0-2 To x0+2
   Do y=y0-2 To y0+2
     z.y=overlay(copies(color,3),z.y,3*x)
     End
   End
 Return
power: Procedure /***********************************************************************
- Return b**x for any x -- with reasonable or specified precision
- 920903 Walter Pachl
- /
 Parse Arg b,x,prec
 If prec<9 Then prec=9
 Numeric Digits (2*prec)
 Numeric Fuzz   3
 If b=0 Then Return 0
 If b<> Then x=x*ln(b,prec+2)
 o=1
 u=1
 r=1
 Do i=1 By 1
   ra=r
   o=o*x
   u=u*i
   r=r+(o/u)
   If r=ra Then Leave
   End
 Numeric Digits (prec)
 Return r+0
ln: Procedure /***********************************************************************
- Return ln(x) -- with specified precision
- Three different series are used for the ranges 0 to 0.5
- 0.5 to 1.5
- 1.5 to infinity
- 920903 Walter Pachl
- /
 Parse Arg x,prec,b
 If prec= Then prec=9
 Numeric Digits (2*prec)
 Numeric Fuzz   3
 Select
   When x<=0 Then r='*** invalid argument ***'
   When x<0.5 Then Do
     z=(x-1)/(x+1)
     o=z
     r=z
     k=1
     Do i=3 By 2
       ra=r
       k=k+1
       o=o*z*z
       r=r+o/i
       If r=ra Then Leave
       End
     r=2*r
     End
   When x<1.5 Then Do
     z=(x-1)
     o=z
     r=z
     k=1
     Do i=2 By 1
       ra=r
       k=k+1
       o=-o*z
       r=r+o/i
       If r=ra Then Leave
       End
     End
   Otherwise /* 1.5<=x */ Do
     z=(x+1)/(x-1)
     o=1/z
     r=o
     k=1
     Do i=3 By 2
       ra=r
       k=k+1
       o=o/(z*z)
       r=r+o/i
       If r=ra Then Leave
       End
     r=2*r
     End
   End
 If b<> Then
   r=r/ln(b)
 Numeric Digits (prec)
 Return r+0</lang>
Scala
Java Swing Interoperability
<lang Scala>import java.awt._ import java.awt.geom.Path2D import java.util
import javax.swing._ import javax.swing.event.{ChangeEvent, ChangeListener}
object SuperEllipse extends App {
   SwingUtilities.invokeLater(() => {
     new JFrame("Super Ellipse") {
       class SuperEllipse extends JPanel with ChangeListener {
         setPreferredSize(new Dimension(650, 650))
         setBackground(Color.white)
         setFont(new Font("Serif", Font.PLAIN, 18))
         private var exp = 2.5
         override def paintComponent(gg: Graphics): Unit = {
           val g = gg.asInstanceOf[Graphics2D]
          def drawGrid(g: Graphics2D): Unit = {
             g.setStroke(new BasicStroke(2))
             g.setColor(new Color(0xEEEEEE))
             val w = getWidth
             val h = getHeight
             val spacing = 25
             for (i <- 0 until (w / spacing)) {
               g.drawLine(0, i * spacing, w, i * spacing)
               g.drawLine(i * spacing, 0, i * spacing, w)
             }
             g.drawLine(0, h - 1, w, h - 1)
             g.setColor(new Color(0xAAAAAA))
             g.drawLine(0, w / 2, w, w / 2)
             g.drawLine(w / 2, 0, w / 2, w)
           }
           def drawLegend(g: Graphics2D): Unit = {
             g.setColor(Color.black)
             g.setFont(getFont)
             g.drawString("n = " + String.valueOf(exp), getWidth - 150, 45)
             g.drawString("a = b = 200", getWidth - 150, 75)
           }
           def drawEllipse(g: Graphics2D): Unit = {
             val a = 200
             // calculate first quadrant
             val points = Array.tabulate(a + 1)(n =>
               math.pow(math.pow(a, exp) - math.pow(n, exp), 1 / exp))
             val p = new Path2D.Double
             p.moveTo(a, 0)
             for (n <- a to 0 by -1) p.lineTo(n, -points(n))
             // mirror to others
             for (x <- points.indices) p.lineTo(x, points(x))
             for (y <- a to 0 by -1) p.lineTo(-y, points(y))
             for (z <- points.indices) p.lineTo(-z, -points(z))
             g.translate(getWidth / 2, getHeight / 2)
             g.setStroke(new BasicStroke(2))
             g.setColor(new Color(0x25B0C4DE, true))
             g.fill(p)
             g.setColor(new Color(0xB0C4DE)) // LightSteelBlue
             g.draw(p)
           }
           super.paintComponent(gg)
           g.setRenderingHint(RenderingHints.KEY_ANTIALIASING, RenderingHints.VALUE_ANTIALIAS_ON)
           g.setRenderingHint(RenderingHints.KEY_TEXT_ANTIALIASING, RenderingHints.VALUE_TEXT_ANTIALIAS_ON)
           drawGrid(g)
           drawLegend(g)
           drawEllipse(g)
         }
         override def stateChanged(e: ChangeEvent): Unit = {
           val source = e.getSource.asInstanceOf[JSlider]
           exp = source.getValue / 2.0
           repaint()
         }
       }
       setDefaultCloseOperation(WindowConstants.EXIT_ON_CLOSE)
       setResizable(false)
       val panel = new SuperEllipse
       add(panel, BorderLayout.CENTER)
       val exponent = new JSlider(SwingConstants.HORIZONTAL, 1, 9, 5)
       exponent.addChangeListener(panel)
       exponent.setBackground(Color.white)
       exponent.setBorder(BorderFactory.createEmptyBorder(20, 20, 20, 20))
       exponent.setMajorTickSpacing(1)
       exponent.setPaintLabels(true)
       val labelTable = new util.Hashtable[Integer, JLabel]
       for (i <- 1 until 10) labelTable.put(i, new JLabel(String.valueOf(i * 0.5)))
       exponent.setLabelTable(labelTable)
       add(exponent, BorderLayout.SOUTH)
       pack()
       setLocationRelativeTo(null)
       setVisible(true)
     }
})
}</lang>
Sidef
<lang ruby>const (
   a = 200,
   b = 200,
   n = 2.5,
)
- y in terms of x
func y(x) { b * (1 - abs(x/a)**n -> root(n)) -> int }
func pline(q) {
   <<-"EOT";
   <polyline points="#{q.join(' ')}"
   style="fill:none; stroke:black; stroke-width:3" transform="translate(#{a}, #{b})" />
   EOT
}
- Generate an SVG image
say <<-"EOT"
   <?xml version="1.0" standalone="no"?>
   <!DOCTYPE svg PUBLIC "-//W3C//DTD SVG 1.1//EN" "http://www.w3.org/Graphics/SVG/1.1/DTD/svg11.dtd">
   <svg height="#{b*2}" width="#{a*2}" version="1.1" xmlns="http://www.w3.org/2000/svg">
   EOT
- find point pairs for one quadrant
var q = { |x| (x, y(x)) }.map(0..200 `by` 2)
[
   pline(q),
   pline(q »*« [ 1,-1]), # flip and mirror
   pline(q »*« [-1,-1]), # for the other
   pline(q »*« [-1, 1]), # three quadrants
].each { .print } say '</svg>'</lang>
Stata
<lang stata>sca a=200 sca b=200 sca n=2.5 twoway function y=b*(1-(abs(x/a))^n)^(1/n), range(-200 200) || function y=-b*(1-(abs(x/a))^n)^(1/n), range(-200 200)</lang>
zkl
Uses the PPM class from http://rosettacode.org/wiki/Bitmap/Bresenham%27s_line_algorithm#zkl

<lang zkl>fcn superEllipse(plot,n,color=0xff0000){ // we'll assume width <= height
  a,p:=(plot.w/2).toFloat(), 1.0/n;  // just calculate upper right quadrant
  foreach x in ([0.0 .. a]){
     y:=(a.pow(n) - x.pow(n)).pow(p);  // a==b>0 --> y=(a^n - x^n)^(1/n)
     //println( (x/a).abs().pow(n) + (y/b).abs().pow(n) );  // sanity check
     plot[x,y]=plot[-x,-y]=plot[-x,y]=plot[x,-y]=color;  // all 4 quadrants
  }
  plot
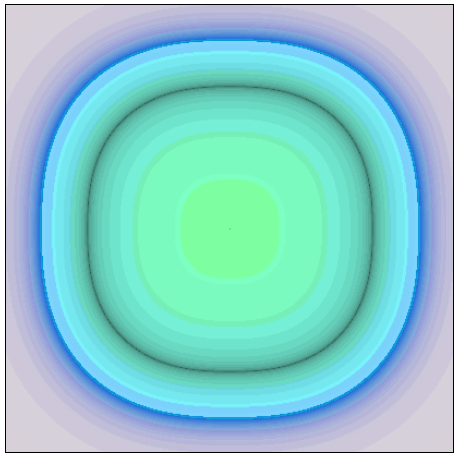
}</lang> <lang zkl>w:=h:=600; plot:=PPM(w+1,h+1,0x909090); plot.cross(w/2,h/2); foreach n in ([0.01..1, 0.14]){ superEllipse(plot,n, 0x0000bb) }// 0-1: blue foreach n in ([1.0.. 2, 0.14]){ superEllipse(plot,n, 0x00ff00) }// 1-2: green foreach n in ([2.0..10, 1.4]) { superEllipse(plot,n, 0xff0000) }// 2+: red
plot.writeJPGFile("superEllipse.jpg");</lang>