
Peano curve: Difference between revisions
| Line 110: | Line 110: | ||
=={{header|Julia}}== |
=={{header|Julia}}== |
||
The peano function is from the C version. |
|||
<lang julia>using Gtk, Graphics, Colors |
<lang julia>using Gtk, Graphics, Colors |
||
Revision as of 20:01, 4 January 2019

You are encouraged to solve this task according to the task description, using any language you may know.
- Task
Produce a graphical or ASCII-art representation of a Peano curve of at least order 3.
C
Adaptation of the C program in the Breinholt-Schierz paper , requires the WinBGIm library. <lang C> /*Abhishek Ghosh, 14th September 2018*/
- include <graphics.h>
- include <math.h>
void Peano(int x, int y, int lg, int i1, int i2) {
if (lg == 1) { lineto(3*x,3*y); return; }
lg = lg/3; Peano(x+(2*i1*lg), y+(2*i1*lg), lg, i1, i2); Peano(x+((i1-i2+1)*lg), y+((i1+i2)*lg), lg, i1, 1-i2); Peano(x+lg, y+lg, lg, i1, 1-i2); Peano(x+((i1+i2)*lg), y+((i1-i2+1)*lg), lg, 1-i1, 1-i2); Peano(x+(2*i2*lg), y+(2*(1-i2)*lg), lg, i1, i2); Peano(x+((1+i2-i1)*lg), y+((2-i1-i2)*lg), lg, i1, i2); Peano(x+(2*(1-i1)*lg), y+(2*(1-i1)*lg), lg, i1, i2); Peano(x+((2-i1-i2)*lg), y+((1+i2-i1)*lg), lg, 1-i1, i2); Peano(x+(2*(1-i2)*lg), y+(2*i2*lg), lg, 1-i1, i2); }
int main(void) {
initwindow(1000,1000,"Peano, Peano");
Peano(0, 0, 1000, 0, 0); /* Start Peano recursion. */
getch(); cleardevice();
return 0; } </lang>
Go
The following is based on the recursive algorithm and C code in this paper scaled up to 81 x 81 points. The image produced is a variant known as a Peano-Meander curve (see Figure 1(b) here).
<lang go>package main
import "github.com/fogleman/gg"
var points []gg.Point
const width = 81
func peano(x, y, lg, i1, i2 int) {
   if lg == 1 {
       px := float64(width-x) * 10
       py := float64(width-y) * 10
       points = append(points, gg.Point{px, py})
       return
   }
   lg /= 3
   peano(x+2*i1*lg, y+2*i1*lg, lg, i1, i2)
   peano(x+(i1-i2+1)*lg, y+(i1+i2)*lg, lg, i1, 1-i2)
   peano(x+lg, y+lg, lg, i1, 1-i2)
   peano(x+(i1+i2)*lg, y+(i1-i2+1)*lg, lg, 1-i1, 1-i2)
   peano(x+2*i2*lg, y+2*(1-i2)*lg, lg, i1, i2)
   peano(x+(1+i2-i1)*lg, y+(2-i1-i2)*lg, lg, i1, i2)
   peano(x+2*(1-i1)*lg, y+2*(1-i1)*lg, lg, i1, i2)
   peano(x+(2-i1-i2)*lg, y+(1+i2-i1)*lg, lg, 1-i1, i2)
   peano(x+2*(1-i2)*lg, y+2*i2*lg, lg, 1-i1, i2)
}
func main() {
   peano(0, 0, width, 0, 0)
   dc := gg.NewContext(820, 820)
   dc.SetRGB(1, 1, 1) // White background
   dc.Clear()
   for _, p := range points {
       dc.LineTo(p.X, p.Y)
   }
   dc.SetRGB(1, 0, 1) // Magenta curve
   dc.SetLineWidth(1)
   dc.Stroke()
   dc.SavePNG("peano.png")
}</lang>
IS-BASIC
<lang IS-BASIC>100 PROGRAM "PeanoC.bas" 110 OPTION ANGLE DEGREES 120 SET VIDEO MODE 5:SET VIDEO COLOR 0:SET VIDEO X 40:SET VIDEO Y 27 130 OPEN #101:"video:" 140 DISPLAY #101:AT 1 FROM 1 TO 27 150 PLOT 280,240,ANGLE 90; 160 CALL PEANO(28,90,6) 170 DEF PEANO(D,A,LEV) 180 IF LEV=0 THEN EXIT DEF 190 PLOT RIGHT A; 200 CALL PEANO(D,-A,LEV-1) 210 PLOT FORWARD D; 220 CALL PEANO(D,A,LEV-1) 230 PLOT FORWARD D; 240 CALL PEANO(D,-A,LEV-1) 250 PLOT LEFT A; 260 END DEF</lang>
Julia
The peano function is from the C version. <lang julia>using Gtk, Graphics, Colors
function peano(ctx, x, y, lg, i1, i2)
   if lg < 3
       line_to(ctx, x- 250, y - 250)
       set_line_width(ctx, 1)
       stroke(ctx)
       move_to(ctx, x - 250 , y - 250)
   else
       lg = div(lg,  3)
       peano(ctx, x + (2 * i1 * lg), y + (2 * i1 * lg), lg, i1, i2)
       peano(ctx, x + ((i1 - i2 + 1) * lg), y + ((i1 + i2) * lg), lg, i1, 1 - i2)
       peano(ctx, x + lg, y + lg, lg, i1, 1 - i2)
       peano(ctx, x + ((i1 + i2) * lg), y + ((i1 - i2 + 1) * lg), lg, 1 - i1, 1 - i2)
       peano(ctx, x + (2 * i2 * lg), y + ( 2 * (1-i2) * lg), lg, i1, i2)
       peano(ctx, x + ((1 + i2 - i1) * lg), y + ((2 - i1 - i2) * lg), lg, i1, i2)
       peano(ctx, x + (2 * (1 - i1) * lg), y + (2 * (1 - i1) * lg), lg, i1, i2)
       peano(ctx, x + ((2 - i1 - i2) * lg), y + ((1 + i2 - i1) * lg), lg, 1 - i1, i2)
       peano(ctx, x + (2 * (1 - i2) * lg), y + (2 * i2 * lg), lg, 1 - i1, i2)
   end
end
const can = @GtkCanvas() const win = GtkWindow(can, "Peano Curve", 500, 500)
@guarded draw(can) do widget
   ctx = getgc(can)
   h = height(can)
   w = width(can)
   set_source(ctx, colorant"blue")
peano(ctx, w/2, h/2, 500, 0, 0) end
show(can) const cond = Condition() endit(w) = notify(cond) signal_connect(endit, win, :destroy) wait(cond) </lang>
Perl
<lang perl>use SVG; use List::Util qw(max min);
use constant pi => 2 * atan2(1, 0);
- Compute the curve with a Lindemayer-system
my %rules = (
   L => 'LFRFL-F-RFLFR+F+LFRFL',
   R => 'RFLFR+F+LFRFL-F-RFLFR'
); my $peano = 'L'; $peano =~ s/([LR])/$rules{$1}/eg for 1..4;
- Draw the curve in SVG
($x, $y) = (0, 0); $theta = pi/2; $r = 4;
for (split //, $peano) {
   if (/F/) {
       push @X, sprintf "%.0f", $x;
       push @Y, sprintf "%.0f", $y;
       $x += $r * cos($theta);
       $y += $r * sin($theta);
   }
   elsif (/\+/) { $theta += pi/2; }
   elsif (/\-/) { $theta -= pi/2; }
}
$max = max(@X,@Y); $xt = -min(@X)+10; $yt = -min(@Y)+10; $svg = SVG->new(width=>$max+20, height=>$max+20); $points = $svg->get_path(x=>\@X, y=>\@Y, -type=>'polyline'); $svg->rect(width=>"100%", height=>"100%", style=>{'fill'=>'black'}); $svg->polyline(%$points, style=>{'stroke'=>'orange', 'stroke-width'=>1}, transform=>"translate($xt,$yt)");
open $fh, '>', 'peano_curve.svg'; print $fh $svg->xmlify(-namespace=>'svg'); close $fh;</lang> Peano curve (offsite image)
Perl 6
<lang perl6>use SVG;
role Lindenmayer {
   has %.rules;
   method succ {
       self.comb.map( { %!rules{$^c} // $c } ).join but Lindenmayer(%!rules)
   }
}
my $peano = 'L' but Lindenmayer( { 'L' => 'LFRFL-F-RFLFR+F+LFRFL', 'R' => 'RFLFR+F+LFRFL-F-RFLFR' } );
$peano++ xx 4; my @points = (10, 10);
for $peano.comb {
   state ($x, $y) = @points[0,1];
   state $d = 0 + 8i;
   when 'F' { @points.append: ($x += $d.re).round(1), ($y += $d.im).round(1) }
   when /< + - >/ { $d *= "{$_}1i" }
   default { }
}
say SVG.serialize(
   svg => [
       :660width, :660height, :style<stroke:lime>,
       :rect[:width<100%>, :height<100%>, :fill<black>],
       :polyline[ :points(@points.join: ','), :fill<black> ],
   ],
);</lang>
See: Peano curve (SVG image)
Phix
Space key toggles between switchback and meander curves. <lang Phix>-- demo\rosetta\peano_curve.exw include pGUI.e
Ihandle dlg, canvas cdCanvas cddbuffer, cdcanvas
bool meander = false -- space toggles (false==draw switchback curve) constant width = 81
sequence points = {}
-- switchback peano: -- -- There are (as per wp) four shapes to draw: -- -- 1: +-v ^ 2: ^ v-+ 3: v ^-+ 2: +-^ v -- | | | | | | | | | | | | -- ^ v-+ +-v ^ +-^ v v ^-+ -- -- 1 starts bottom left, ends top right -- 2 starts bottom right, ends top left -- 3 starts top left, ends bottom right -- 4 starts top right, ends bottom left -- -- given the centre point (think {1,1}), and using {0,0} as the bottom left: -- constant shapes = {{{-1,-1},{-1,0},{-1,+1},{0,+1},{0,0},{0,-1},{+1,-1},{+1,0},{+1,+1}},
                  {{+1,-1},{+1,0},{+1,+1},{0,+1},{0,0},{0,-1},{-1,-1},{-1,0},{-1,+1}},     -- (== sq_mul(shapes[1],{-1,0}))
                  {{-1,+1},{-1,0},{-1,-1},{0,-1},{0,0},{0,+1},{+1,+1},{+1,0},{+1,-1}},     -- (== reverse(shapes[2]))
                  {{+1,+1},{+1,0},{+1,-1},{0,-1},{0,0},{0,+1},{-1,+1},{-1,0},{-1,-1}}}     -- (== reverse(shapes[1]))
constant subshapes = {{1,2,1,3,4,3,1,2,1},
                     {2,1,2,4,3,4,2,1,2},      -- == sq_sub({3,3,3,7,7,7,3,3,3},subshapes[1])
                     {3,4,3,1,2,1,3,4,3},      -- == sq_sub(5,subshapes[2])
                     {4,3,4,2,1,2,4,3,4}}      -- == sq_sub(5,subshapes[1])
-- As noted, it should theoretically be possible to simplify/shorten/remove/inline those tables
procedure switchback_peano(integer x, y, level, shape) -- (written from scratch, with a nod to the meander algorithm [below])
   if level<=1 then
       points = append(points, {x*10, y*10})
       return
   end if
   level /= 3
   for i=1 to 9 do
       integer {dx,dy} = shapes[shape][i]
       switchback_peano(x+dx*level,y+dy*level,level,subshapes[shape][i])
   end for
end procedure
procedure meander_peano(integer x, y, lg, i1, i2) -- (translated from Go)
   if lg=1 then
       integer px := (width-x) * 10,
               py := (width-y) * 10
       points = append(points, {px, py})
       return
   end if
   lg /= 3
   meander_peano(x+2*i1*lg, y+2*i1*lg, lg, i1, i2)
   meander_peano(x+(i1-i2+1)*lg, y+(i1+i2)*lg, lg, i1, 1-i2)
   meander_peano(x+lg, y+lg, lg, i1, 1-i2)
   meander_peano(x+(i1+i2)*lg, y+(i1-i2+1)*lg, lg, 1-i1, 1-i2)
   meander_peano(x+2*i2*lg, y+2*(1-i2)*lg, lg, i1, i2)
   meander_peano(x+(1+i2-i1)*lg, y+(2-i1-i2)*lg, lg, i1, i2)
   meander_peano(x+2*(1-i1)*lg, y+2*(1-i1)*lg, lg, i1, i2)
   meander_peano(x+(2-i1-i2)*lg, y+(1+i2-i1)*lg, lg, 1-i1, i2)
   meander_peano(x+2*(1-i2)*lg, y+2*i2*lg, lg, 1-i1, i2)
end procedure
function redraw_cb(Ihandle /*ih*/, integer /*posx*/, integer /*posy*/)
   if length(points)=0 then
       if meander then
           meander_peano(0, 0, width, 0, 0)
       else
           switchback_peano(41, 41, width, 1)
       end if
   end if
   cdCanvasActivate(cddbuffer)
   cdCanvasBegin(cddbuffer, CD_OPEN_LINES)
   for i=1 to length(points) do
       integer {x,y} = points[i]
       cdCanvasVertex(cddbuffer, x, y)
   end for
   cdCanvasEnd(cddbuffer)
   cdCanvasFlush(cddbuffer)
   return IUP_DEFAULT
end function
function map_cb(Ihandle ih)
   cdcanvas = cdCreateCanvas(CD_IUP, ih)
   cddbuffer = cdCreateCanvas(CD_DBUFFER, cdcanvas)
   cdCanvasSetBackground(cddbuffer, CD_WHITE)
   cdCanvasSetForeground(cddbuffer, CD_MAGENTA)
   return IUP_DEFAULT
end function
function esc_close(Ihandle /*ih*/, atom c)
   if c=K_ESC then return IUP_CLOSE end if
   if c=' ' then
       meander = not meander
       points = {}
       cdCanvasClear(cddbuffer)
       IupUpdate(canvas)
   end if
   return IUP_CONTINUE
end function
procedure main()
   IupOpen()

   canvas = IupCanvas(NULL)
   IupSetAttribute(canvas, "RASTERSIZE", "822x822") -- initial size
   IupSetCallback(canvas, "MAP_CB", Icallback("map_cb"))
   dlg = IupDialog(canvas)
   IupSetAttribute(dlg, "TITLE", "Peano Curve")
   IupSetAttribute(dlg, "DIALOGFRAME", "YES")  -- no resize here
   IupSetCallback(dlg, "K_ANY",     Icallback("esc_close"))
   IupSetCallback(canvas, "ACTION", Icallback("redraw_cb"))
   IupMap(dlg)
   IupShowXY(dlg,IUP_CENTER,IUP_CENTER)
   IupMainLoop()
   IupClose()
end procedure main()</lang>
Racket
Draw the Peano curve using the classical turtle style known from Logo.
The MetaPict library is used to implement a turtle.
See also https://pdfs.semanticscholar.org/fee6/187cc2dd1679d4976db9522b06a49f63be46.pdf <lang Racket> /* Jens Axel Søgaard, 27th December 2018*/
- lang racket
(require metapict metapict/mat)
- Turtle State
(define p (pt 0 0)) ; current position (define d (vec 0 1)) ; current direction (define c '()) ; line segments drawn so far
- Turtle Operations
(define (jump q) (set! p q)) (define (move q) (set! c (cons (curve p -- q) c)) (set! p q)) (define (forward x) (move (pt+ p (vec* x d)))) (define (left a) (set! d (rot a d))) (define (right a) (left (- a)))
- Peano
(define (peano n a h)
 (unless (= n 0)
   (right a)
   (peano (- n 1) (- a) h)
   (forward h)
   (peano (- n 1) a h)
   (forward h)
   (peano (- n 1) (- a) h)
   (left a)))
- Produce image
(set-curve-pict-size 400 400) (with-window (window -1 81 -1 82)
 (peano 6 90 3)
 (draw* c))
</lang>
VBA
<lang vb>Const WIDTH = 243 'a power of 3 for a evenly spaced curve Dim n As Long Dim points() As Single Dim flag As Boolean 'Store the coordinate pairs (x, y) generated by Peano into 'a SafeArrayOfPoints with lineto. The number of points 'generated depend on WIDTH. Peano is called twice. Once 'to count the number of points, and twice to generate 'the points after the dynamic array has been 'redimensionalised. 'VBA doesn't have a lineto method. Instead of AddLine, which 'requires four parameters, including the begin pair of 'coordinates, the method AddPolyline is used, which is 'called from main after all the points are generated. 'This creates a single object, whereas AddLine would 'create thousands of small unconnected line objects. Private Sub lineto(x As Integer, y As Integer)
   If flag Then
       points(n, 1) = x
       points(n, 2) = y
   End If
   n = n + 1
End Sub Private Sub Peano(ByVal x As Integer, ByVal y As Integer, ByVal lg As Integer, _
   ByVal i1 As Integer, ByVal i2 As Integer)
   If (lg = 1) Then
       Call lineto(x * 3, y * 3)
       Exit Sub
   End If
   lg = lg / 3
   Call Peano(x + (2 * i1 * lg), y + (2 * i1 * lg), lg, i1, i2)
   Call Peano(x + ((i1 - i2 + 1) * lg), y + ((i1 + i2) * lg), lg, i1, 1 - i2)
   Call Peano(x + lg, y + lg, lg, i1, 1 - i2)
   Call Peano(x + ((i1 + i2) * lg), y + ((i1 - i2 + 1) * lg), lg, 1 - i1, 1 - i2)
   Call Peano(x + (2 * i2 * lg), y + (2 * (1 - i2) * lg), lg, i1, i2)
   Call Peano(x + ((1 + i2 - i1) * lg), y + ((2 - i1 - i2) * lg), lg, i1, i2)
   Call Peano(x + (2 * (1 - i1) * lg), y + (2 * (1 - i1) * lg), lg, i1, i2)
   Call Peano(x + ((2 - i1 - i2) * lg), y + ((1 + i2 - i1) * lg), lg, 1 - i1, i2)
   Call Peano(x + (2 * (1 - i2) * lg), y + (2 * i2 * lg), lg, 1 - i1, i2)
End Sub Sub main()
   n = 1: flag = False
   Call Peano(0, 0, WIDTH, 0, 0) 'Start Peano recursion to count number of points
   ReDim points(1 To n - 1, 1 To 2)
   n = 1: flag = True
   Call Peano(0, 0, WIDTH, 0, 0) 'Start Peano recursion to generate and store points
   ActiveSheet.Shapes.AddPolyline points 'Excel assumed
End Sub</lang>
zkl
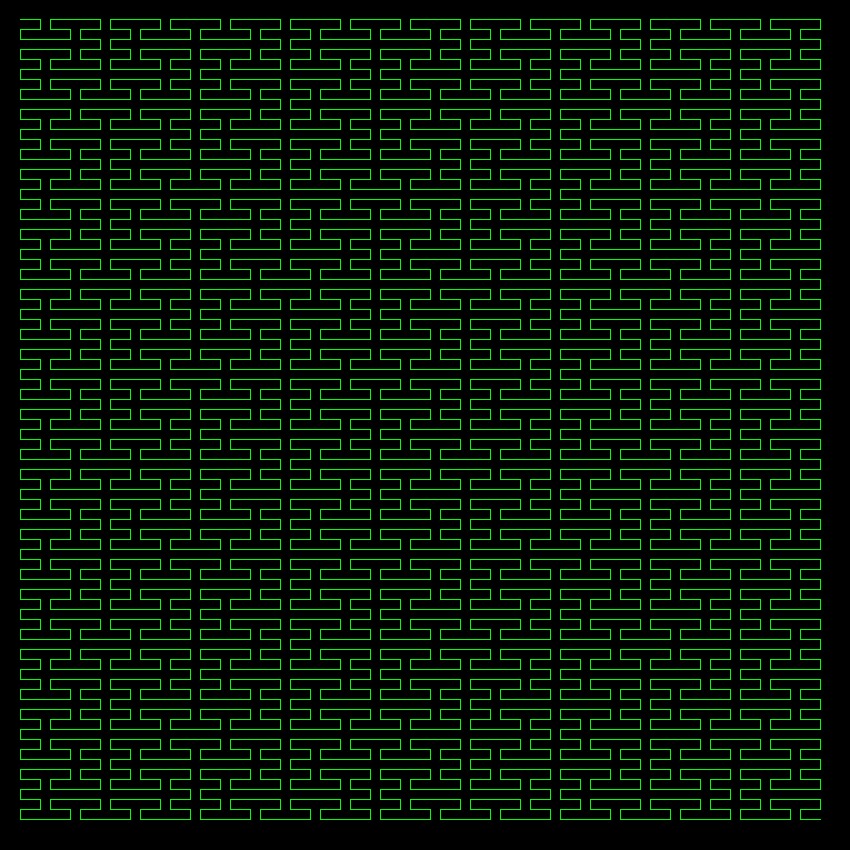
Using a Lindenmayer system and turtle graphics & turned 90°: <lang zkl>lsystem("L", // axiom
 Dictionary("L","LFRFL-F-RFLFR+F+LFRFL", "R","RFLFR+F+LFRFL-F-RFLFR"), # rules
 "+-F", 4)				  	// constants, order
- turtle(_);
fcn lsystem(axiom,rules,consts,n){ // Lindenmayer system --> string
  foreach k in (consts){ rules.add(k,k) }
  buf1,buf2 := Data(Void,axiom).howza(3), Data().howza(3);  // characters
  do(n){
     buf1.pump(buf2.clear(), rules.get);
     t:=buf1; buf1=buf2; buf2=t;	// swap buffers
  }
  buf1.text		// n=4 --> 16,401  characters
}</lang> Using Image Magick and the PPM class from http://rosettacode.org/wiki/Bitmap/Bresenham%27s_line_algorithm#zkl <lang zkl>fcn turtle(koch){
  const D=10.0;
  dir,angle, x,y := 0.0, (90.0).toRad(), 20.0, 830.0; // turtle; x,y are float
  img,color := PPM(850,850), 0x00ff00;
  foreach c in (koch){
     switch(c){
case("F"){ // draw forward dx,dy := D.toRectangular(dir); tx,ty := x,y; x,y = (x+dx),(y+dy); img.line(tx.toInt(),ty.toInt(), x.toInt(),y.toInt(), color); } case("-"){ dir-=angle } // turn right case("+"){ dir+=angle } // turn left
     }
  }
  img.writeJPGFile("peanoCurve.zkl.jpg");
}</lang>
- Output:
Image at Peano curve