
Peano curve: Difference between revisions
(→{{header|zkl}}: added code) |
(Added Go) |
||
| Line 4: | Line 4: | ||
Produce a graphical or ASCII-art representation of a [[wp:Peano curve|Peano curve]] of at least order 3. |
Produce a graphical or ASCII-art representation of a [[wp:Peano curve|Peano curve]] of at least order 3. |
||
=={{header|Go}}== |
|||
{{libheader|Go Graphics}} |
|||
<br> |
|||
The following is based on the recursive algorithm and C code in [https://www.researchgate.net/profile/Christoph_Schierz2/publication/228982573_A_recursive_algorithm_for_the_generation_of_space-filling_curves/links/0912f505c2f419782c000000/A-recursive-algorithm-for-the-generation-of-space-filling-curves.pdf this paper] scaled up to 81 x 81 points. The image produced is a variant known as a Peano-Meander curve (see Figure 1(b) [https://www5.in.tum.de/lehre/vorlesungen/asc/ss17/blatt10/ws10.pdf here]). |
|||
<lang go>package main |
|||
import "github.com/fogleman/gg" |
|||
var points []gg.Point |
|||
const width = 81 |
|||
func peano(x, y, lg, i1, i2 int) { |
|||
if lg == 1 { |
|||
px := float64(width-x) * 10 |
|||
py := float64(width-y) * 10 |
|||
points = append(points, gg.Point{px, py}) |
|||
return |
|||
} |
|||
lg /= 3 |
|||
peano(x+2*i1*lg, y+2*i1*lg, lg, i1, i2) |
|||
peano(x+(i1-i2+1)*lg, y+(i1+i2)*lg, lg, i1, 1-i2) |
|||
peano(x+lg, y+lg, lg, i1, 1-i2) |
|||
peano(x+(i1+i2)*lg, y+(i1-i2+1)*lg, lg, 1-i1, 1-i2) |
|||
peano(x+2*i2*lg, y+2*(1-i2)*lg, lg, i1, i2) |
|||
peano(x+(1+i2-i1)*lg, y+(2-i1-i2)*lg, lg, i1, i2) |
|||
peano(x+2*(1-i1)*lg, y+2*(1-i1)*lg, lg, i1, i2) |
|||
peano(x+(2-i1-i2)*lg, y+(1+i2-i1)*lg, lg, 1-i1, i2) |
|||
peano(x+2*(1-i2)*lg, y+2*i2*lg, lg, 1-i1, i2) |
|||
} |
|||
func main() { |
|||
peano(0, 0, width, 0, 0) |
|||
dc := gg.NewContext(820, 820) |
|||
dc.SetRGB(1, 1, 1) // White background |
|||
dc.Clear() |
|||
for _, p := range points { |
|||
dc.LineTo(p.X, p.Y) |
|||
} |
|||
dc.SetRGB(1, 0, 1) // Magenta curve |
|||
dc.SetLineWidth(1) |
|||
dc.Stroke() |
|||
dc.SavePNG("peano.png") |
|||
}</lang> |
|||
=={{header|Perl 6}}== |
=={{header|Perl 6}}== |
||
Revision as of 10:31, 28 August 2018
- Task
Produce a graphical or ASCII-art representation of a Peano curve of at least order 3.
Go
The following is based on the recursive algorithm and C code in this paper scaled up to 81 x 81 points. The image produced is a variant known as a Peano-Meander curve (see Figure 1(b) here).
<lang go>package main
import "github.com/fogleman/gg"
var points []gg.Point
const width = 81
func peano(x, y, lg, i1, i2 int) {
   if lg == 1 {
       px := float64(width-x) * 10
       py := float64(width-y) * 10
       points = append(points, gg.Point{px, py})
       return
   }
   lg /= 3
   peano(x+2*i1*lg, y+2*i1*lg, lg, i1, i2)
   peano(x+(i1-i2+1)*lg, y+(i1+i2)*lg, lg, i1, 1-i2)
   peano(x+lg, y+lg, lg, i1, 1-i2)
   peano(x+(i1+i2)*lg, y+(i1-i2+1)*lg, lg, 1-i1, 1-i2)
   peano(x+2*i2*lg, y+2*(1-i2)*lg, lg, i1, i2)
   peano(x+(1+i2-i1)*lg, y+(2-i1-i2)*lg, lg, i1, i2)
   peano(x+2*(1-i1)*lg, y+2*(1-i1)*lg, lg, i1, i2)
   peano(x+(2-i1-i2)*lg, y+(1+i2-i1)*lg, lg, 1-i1, i2)
   peano(x+2*(1-i2)*lg, y+2*i2*lg, lg, 1-i1, i2)
}
func main() {
   peano(0, 0, width, 0, 0)
   dc := gg.NewContext(820, 820)
   dc.SetRGB(1, 1, 1) // White background
   dc.Clear()
   for _, p := range points {
       dc.LineTo(p.X, p.Y)
   }
   dc.SetRGB(1, 0, 1) // Magenta curve
   dc.SetLineWidth(1)
   dc.Stroke()
   dc.SavePNG("peano.png")
}</lang>
Perl 6
<lang perl6>use SVG;
role Lindenmayer {
   has %.rules;
   method succ {
       self.comb.map( { %!rules{$^c} // $c } ).join but Lindenmayer(%!rules)
   }
}
my $peano = 'L' but Lindenmayer( { 'L' => 'LFRFL-F-RFLFR+F+LFRFL', 'R' => 'RFLFR+F+LFRFL-F-RFLFR' } );
$peano++ xx 4; my @points = (10, 10);
for $peano.comb {
   state ($x, $y) = @points[0,1];
   state $d = 0 + 8i;
   when 'F' { @points.append: ($x += $d.re).round(1), ($y += $d.im).round(1) }
   when /< + - >/ { $d *= "{$_}1i" }
   default { }
}
say SVG.serialize(
   svg => [
       :660width, :660height, :style<stroke:lime>,
       :rect[:width<100%>, :height<100%>, :fill<black>],
       :polyline[ :points(@points.join: ','), :fill<black> ],
   ],
);</lang>
See: Peano curve (SVG image)
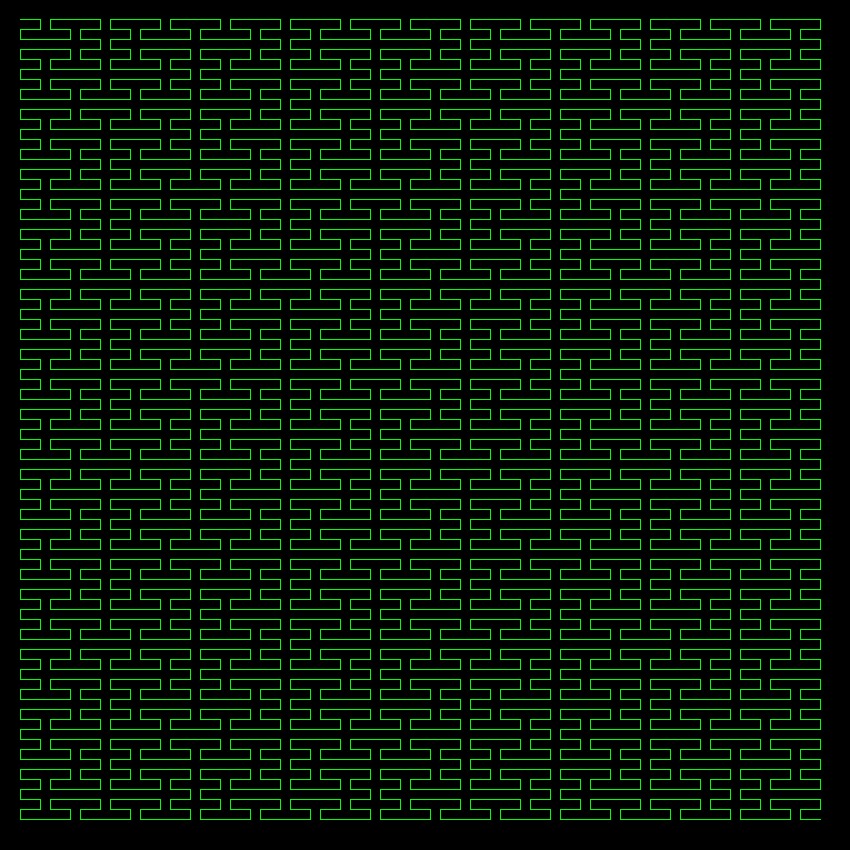
zkl
Using a Lindenmayer system and turtle graphics & turned 90°: <lang zkl>lsystem("L", // axiom
 Dictionary("L","LFRFL-F-RFLFR+F+LFRFL", "R","RFLFR+F+LFRFL-F-RFLFR"), # rules
 "+-F", 4)				  	// constants, order
- turtle(_);
fcn lsystem(axiom,rules,consts,n){ // Lindenmayer system --> string
  foreach k in (consts){ rules.add(k,k) }
  buf1,buf2 := Data(Void,axiom).howza(3), Data().howza(3);  // characters
  do(n){
     buf1.pump(buf2.clear(), rules.get);
     t:=buf1; buf1=buf2; buf2=t;	// swap buffers
  }
  buf1.text		// n=4 --> 16,401  characters
}</lang> Using Image Magick and the PPM class from http://rosettacode.org/wiki/Bitmap/Bresenham%27s_line_algorithm#zkl <lang zkl>fcn turtle(koch){
  const D=10.0;
  dir,angle, x,y := 0.0, (90.0).toRad(), 20.0, 830.0; // turtle; x,y are float
  img,color := PPM(850,850), 0x00ff00;
  foreach c in (koch){
     switch(c){
case("F"){ // draw forward dx,dy := D.toRectangular(dir); tx,ty := x,y; x,y = (x+dx),(y+dy); img.line(tx.toInt(),ty.toInt(), x.toInt(),y.toInt(), color); } case("-"){ dir-=angle } // turn right case("+"){ dir+=angle } // turn left
     }
  }
  img.writeJPGFile("peanoCurve.zkl.jpg");
}</lang>
- Output:
Image at Peano curve